![]() Trusted Editorial content, reviewed by leading industry experts and seasoned editors. Ad Disclosure
Ethereum and Solana are gradually demonstrating bullish movements following a rebound on Tuesday, but the broader outlook still appears to be bearish. On-chain metrics are flashing caution as selling pressure continues to dominate among investors of ETH and SOL, suggesting an extension of the ongoing volatile market.
Trusted Editorial content, reviewed by leading industry experts and seasoned editors. Ad Disclosure
Ethereum and Solana are gradually demonstrating bullish movements following a rebound on Tuesday, but the broader outlook still appears to be bearish. On-chain metrics are flashing caution as selling pressure continues to dominate among investors of ETH and SOL, suggesting an extension of the ongoing volatile market.
Market Balance Tilts Bearish For Ethereum And Solana
While the broader cryptocurrency market has faced steady downside pressure over the past few weeks, the market dynamics of both Ethereum and Solana are undergoing a crucial shift. This shift is being reflected in the Buy/Sell Pressure Delta for ETH and SOL, which has recently turned negative.
Related Reading: Ethereum Vs. Solana: Why BlackRock’s Former Crypto Head Is Betting On ETHThe Buy/Sell Pressure Delta is a key metric that measures the imbalance between buying and selling forces in the market. It is worth noting that when the delta goes negative, it indicates a lack of bullish momentum since selling pressure is greater than purchasing pressure.
According to Alphractal, an advanced on-chain data analytics platform, the metric flipping negative suggests that Ethereum and Solana sellers are gaining control of the market. With buying momentum currently fading, the risk of short-term downside or consolidation becomes high
![Ethereum]() Selling pressure outweighing buying activity | Source: Chart from Alphractal on XThis shift typically points to trend exhaustion, not necessarily an immediate reversal. It also points to a cooling phase after periods of stronger momentum and buying activity. In some scenarios from the past, the platform highlighted that a negative Buy/Sell Pressure Delta has also led to price bottoms. However, this is mostly common when selling pressure starts to lose strength again, with capital flows favoring accumulation over distribution.
Selling pressure outweighing buying activity | Source: Chart from Alphractal on XThis shift typically points to trend exhaustion, not necessarily an immediate reversal. It also points to a cooling phase after periods of stronger momentum and buying activity. In some scenarios from the past, the platform highlighted that a negative Buy/Sell Pressure Delta has also led to price bottoms. However, this is mostly common when selling pressure starts to lose strength again, with capital flows favoring accumulation over distribution.
Furthermore, Alphractal noted that for this ongoing trend to signal a potential bottom in Ethereum and Solana prices, it is critical to monitor whether the delta is exhibiting stability or a recovery, rather than expanding further into negative territory. In the meantime, analyzing the lower timeframes would aid in spotting early signs of a shift back toward buying pressure.
At this point, it is not a standalone signal, and context matters. Price action, volume, and broader on-chain data must confirm whether the market is transitioning into a period of continuation or accumulation. As this imbalance develops across the two networks, it increases the downside risk and emphasizes how crucial it is to keep an eye on whether demand can stabilize or keep declining in the upcoming sessions.
ETH Position Inside A Dense Basis Cluster
Ethereum remains capped by the growing volatility across the crypto market, hovering below the $3,000 price mark. After delving into ETH’s recent price action, Chris Beamish has outlined that the leading altcoin is trading on a dense cost basis cluster
Related Reading: Ethereum Holds $3,000 as Whales Accumulate: Key Resistance and Support Levels to WatchThe positioning carries significance as it represents a breakeven zone for many ETH holders. As ETH holds this zone, the market is leaning toward absorption and the formation of a base. However, a breakdown would move the price into thinner support where underwater supply may derisk.
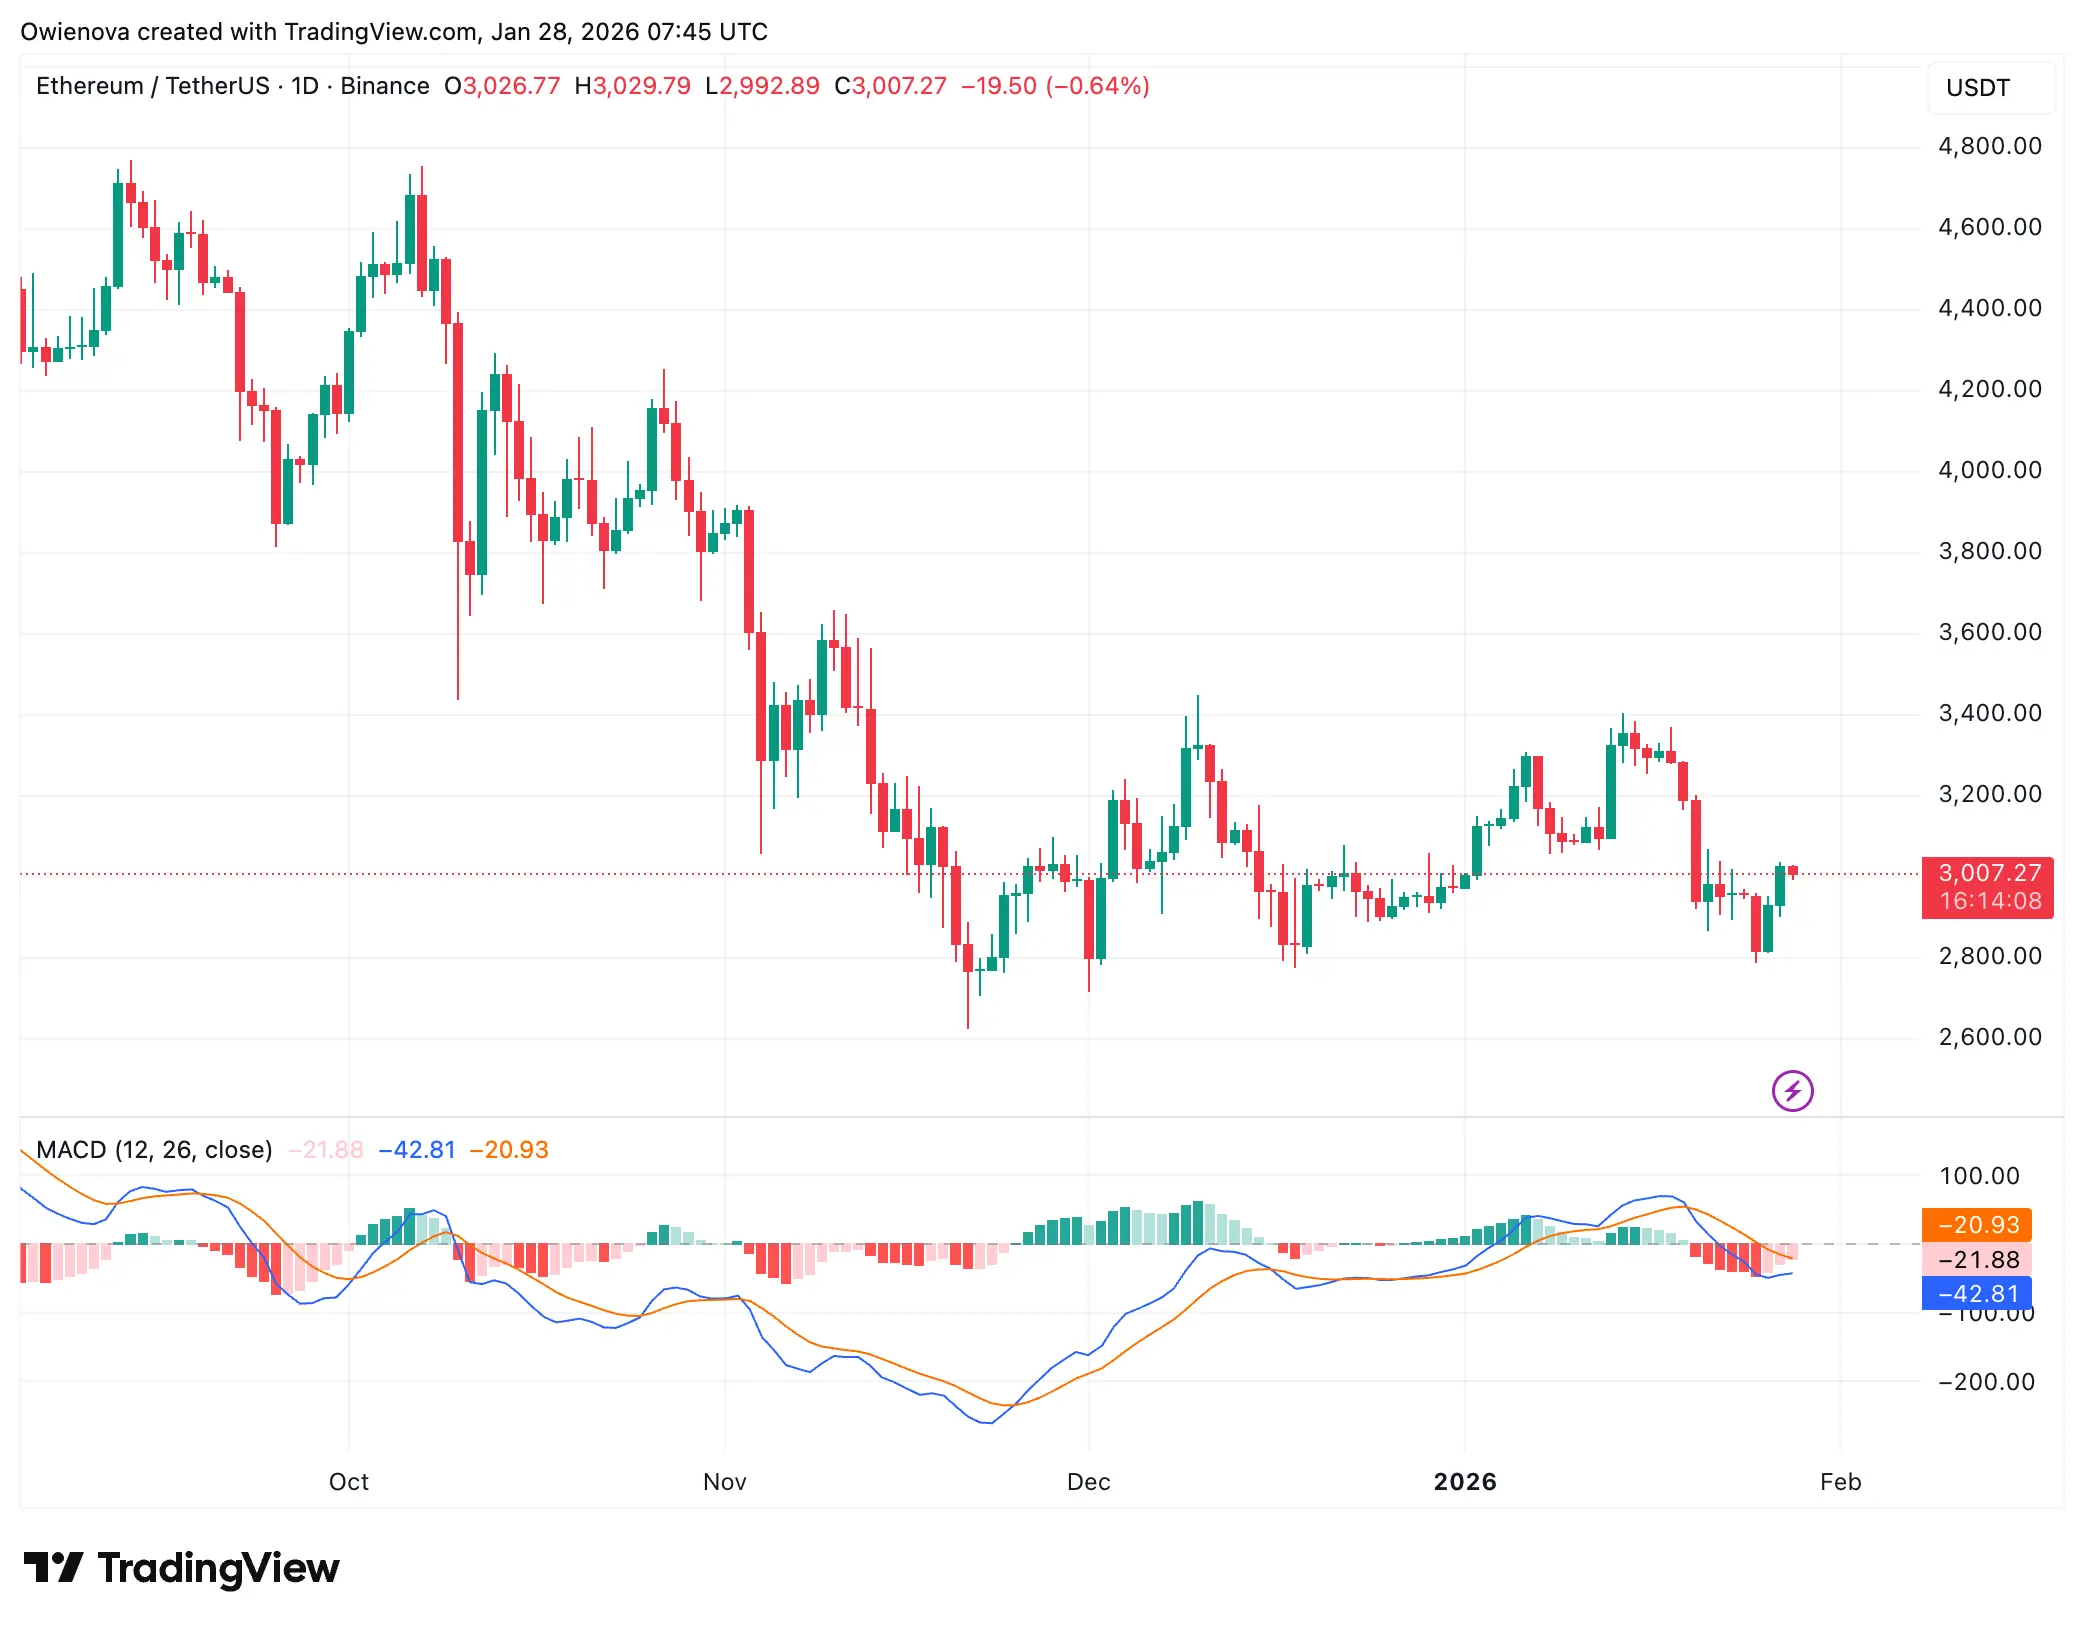 ETH trading at $3,007 on the 1D chart | Source: ETHUSDT on Tradingview.comFeatured image from Pixel Plex, chart from Tradingview.com
![]() Editorial Process for bitcoinist is centered on delivering thoroughly researched, accurate, and unbiased content. We uphold strict sourcing standards, and each page undergoes diligent review by our team of top technology experts and seasoned editors. This process ensures the integrity, relevance, and value of our content for our readers.
Editorial Process for bitcoinist is centered on delivering thoroughly researched, accurate, and unbiased content. We uphold strict sourcing standards, and each page undergoes diligent review by our team of top technology experts and seasoned editors. This process ensures the integrity, relevance, and value of our content for our readers.
Disclaimer: The information on this page may come from third parties and does not represent the views or opinions of Gate. The content displayed on this page is for reference only and does not constitute any financial, investment, or legal advice. Gate does not guarantee the accuracy or completeness of the information and shall not be liable for any losses arising from the use of this information. Virtual asset investments carry high risks and are subject to significant price volatility. You may lose all of your invested principal. Please fully understand the relevant risks and make prudent decisions based on your own financial situation and risk tolerance. For details, please refer to
Disclaimer.
Articoli correlati
Venus Protocol 攻擊者轉移 2301 枚 ETH,流入 Tornado Cash 清洗
根據鏈上分析師 Ai 阿姨於 4 月 22 日的監測,Venus Protocol 攻擊者在 11 小時前向地址 0xa21…23A7f 轉移 2,301 枚 ETH(約 532 萬美元),隨後將資金分批轉入加密混合器 Tornado Cash 進行清洗;截至監測時,攻擊者鏈上仍持有約 1,745 萬美元的 ETH。
MarketWhisper43m fa
Bitfire 收購李林家族辦公室交易團隊,初始投資意願達 5 億美元
據彭博社於 4 月 22 日報導,香港上市財富管理公司 Bitfire Group Holdings 從火幣集團創辦人李林旗下的家族辦公室 Avenir Group 收購約 20 人交易團隊及其交易系統。Bitfire 執行長 Livio Weng 向彭博社確認交易,表示整合後公司已獲約 5 億美元初始投資意願。
MarketWhisper1h fa
OP Labs Launches Privacy Boost Tool for Ethereum DeFi Applications
Gate News message, April 22 — OP Labs announced the launch of Privacy Boost, a privacy product first deployed on OP Mainnet (formerly Optimism), designed to attract more enterprises into the Ethereum ecosystem. The product, offered as a software development kit and API interface, enables private tra
GateNews1h fa
Venus Attacker Transfers 2,301 ETH to Mixer, Tornado Cash Used for Laundering
On-chain analysis tracks a Venus protocol attacker moving 2,301 ETH (~$5.32M) to a suspected wallet, then batching through Tornado Cash; about $17.45M remains on-chain.
Abstract: This note summarizes on-chain activity related to a Venus protocol attacker, including the transfer of 2,301 ETH (~$5.32M) to a wallet and batch-mixing via Tornado Cash, with approximately $17.45M still held on-chain.
GateNews1h fa
Etherealize Sets Long-Term ETH Price Target at $250K, Down from Prior $740K Forecast
Gate News message, April 22 — Etherealize, the institutional marketing and product division of the Ethereum ecosystem, has set a long-term price target for ETH at $250,000 per token, a significant downward revision from its previous target of $740,000 announced last year. The report did not
GateNews2h fa
Bitmine 追加質押 61232 枚 ETH,Tom Lee:加密寒冬即將結束
加密貨幣資產管理公司 Bitmine 於 4 月 22 日再次追加 61,232 枚 ETH(約 1.42 億美元)的質押,使其 ETH 質押總量達到 3,395,869 枚,總市值逼近 79 億美元。Bitmine 董事長 Tom Lee 表示,以太坊正處於「迷你加密寒冬」的最後階段,多項跡象指向復甦即將到來。
MarketWhisper2h fa
