Trade
Trading Type
Spot
Trade crypto freely
Alpha
Points
Get promising tokens in streamlined on-chain trading
Pre-Market
Trade new tokens before they are officially listed
Margin
Magnify your profit with leverage
Convert & Block Trading
0 Fees
Trade any size with no fees and no slippage
Leveraged Tokens
Get exposure to leveraged positions simply
Futures
Futures
Hundreds of contracts settled in USDT or BTC
Options
HOT
Trade European-style vanilla options
Unified Account
Maximize your capital efficiency
Demo Trading
Futures Kickoff
Get prepared for your futures trading
Futures Events
Participate in events to win generous rewards
Demo Trading
Use virtual funds to experience risk-free trading
Earn
Launch
CandyDrop
Collect candies to earn airdrops
Launchpool
Quick staking, earn potential new tokens
HODLer Airdrop
Hold GT and get massive airdrops for free
Launchpad
Be early to the next big token project
Alpha Points
NEW
Trade on-chain assets and enjoy airdrop rewards!
Futures Points
NEW
Earn futures points and claim airdrop rewards
Investment
Simple Earn
Earn interests with idle tokens
Auto-Invest
Auto-invest on a regular basis
Dual Investment
Buy low and sell high to take profits from price fluctuations
Soft Staking
Earn rewards with flexible staking
Crypto Loan
0 Fees
Pledge one crypto to borrow another
Lending Center
One-stop lending hub
VIP Wealth Hub
Customized wealth management empowers your assets growth
Private Wealth Management
Customized asset management to grow your digital assets
Quant Fund
Top asset management team helps you profit without hassle
Staking
Stake cryptos to earn in PoS products
BTC Staking
HOT
Stake BTC and earn 10% APR
GUSD Minting
Use USDT/USDC to mint GUSD for treasury-level yields

More
AAChenHaoyu
No content yet
AAChenHaoyu
 0
0
Evening of 12.7
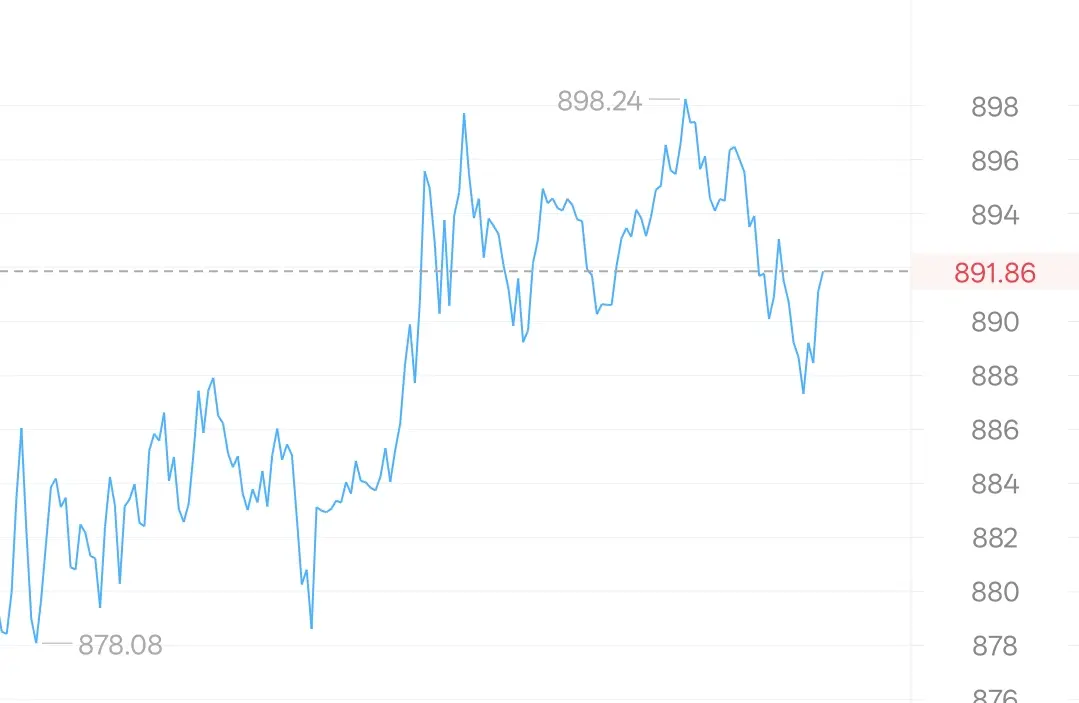
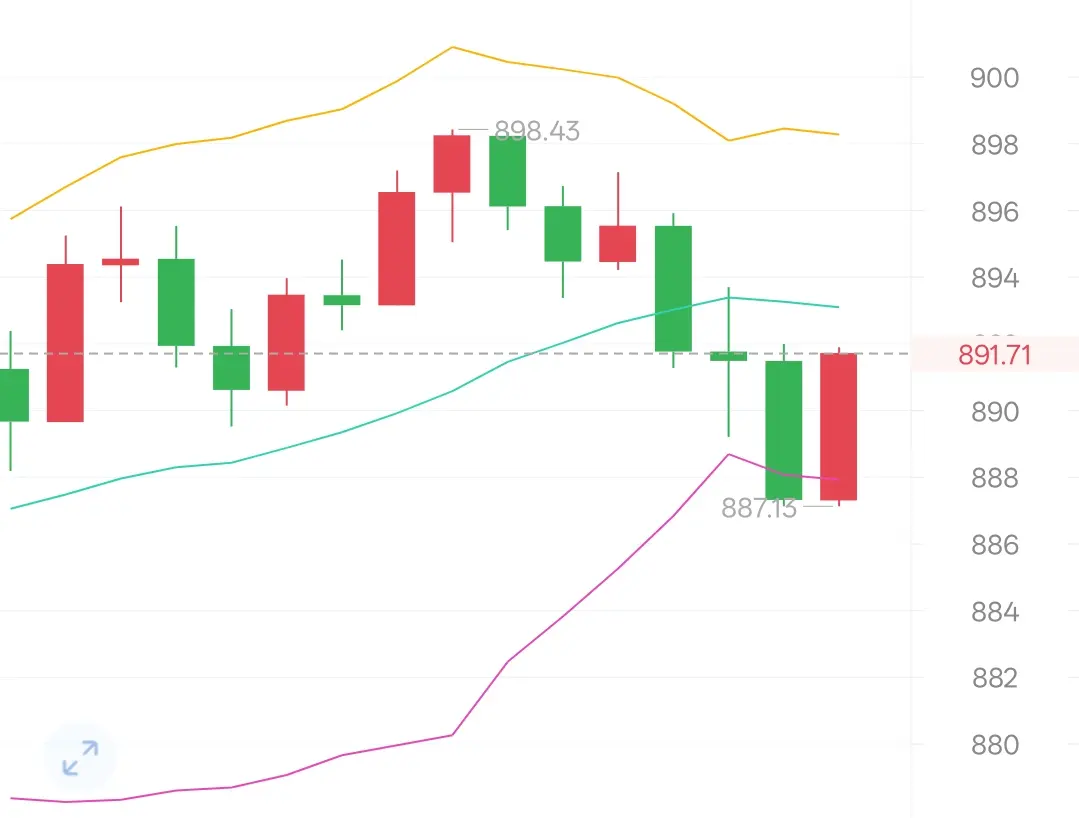
From the perspective of the 1-hour K-line period and technical indicators, BNB is showing a weak rebound characteristic after a sharp drop in the short term; recently, the price surged to 898.43 and then quickly pulled back, with a large bearish candlestick breaking below the middle Bollinger Band at 893.10, reaching a low of 887.15, close to the lower Bollinger Band at 887.93. This was followed by a bullish candlestick with a rebound back to 891, forming a “sharp surge and crash + low-level rebound” oscillating pattern. The downward momentum has been partially released, but th
From the perspective of the 1-hour K-line period and technical indicators, BNB is showing a weak rebound characteristic after a sharp drop in the short term; recently, the price surged to 898.43 and then quickly pulled back, with a large bearish candlestick breaking below the middle Bollinger Band at 893.10, reaching a low of 887.15, close to the lower Bollinger Band at 887.93. This was followed by a bullish candlestick with a rebound back to 891, forming a “sharp surge and crash + low-level rebound” oscillating pattern. The downward momentum has been partially released, but th
BNB1.06%
MC:$3.6KHolders:4
0.00%
- Reward
- 1
- 1
- Repost
- Share
AAChenHaoyu:
Just go for it 💪Evening of December 7
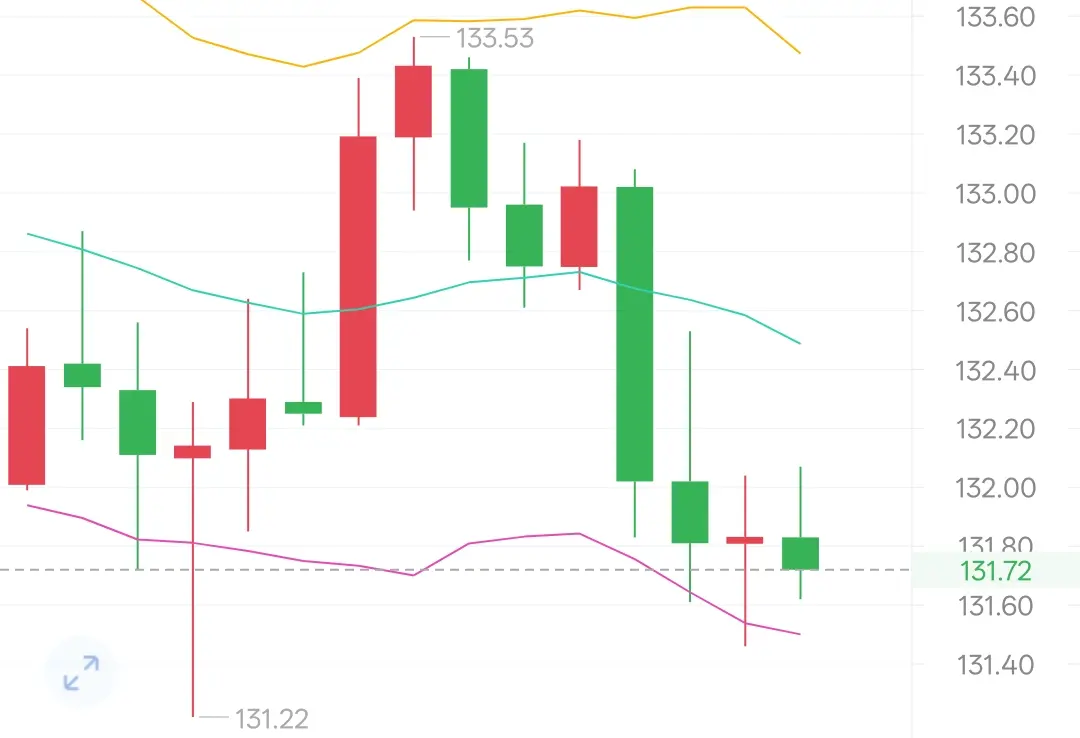
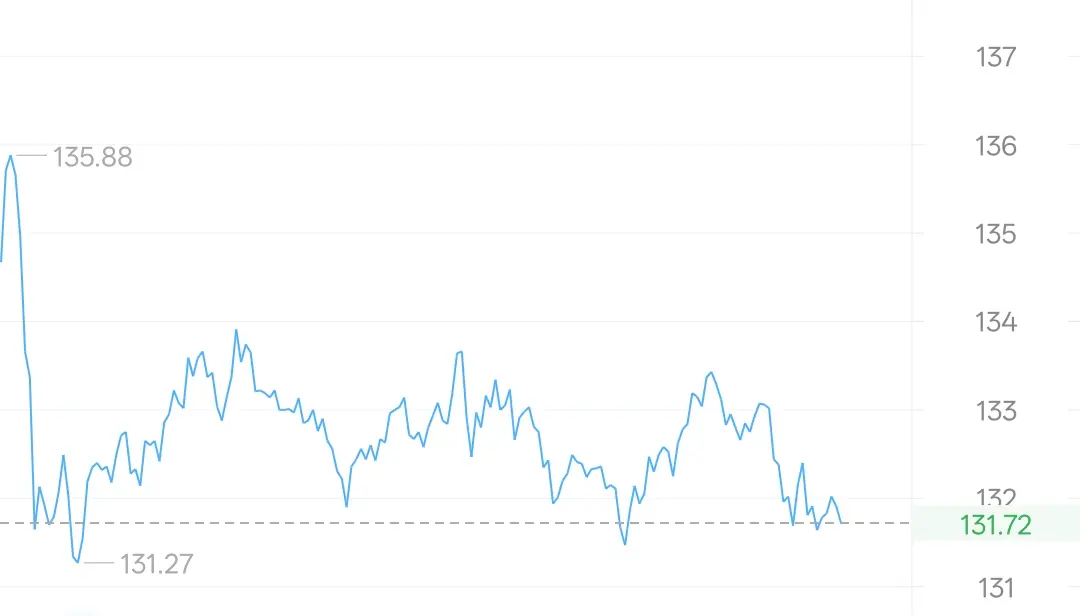
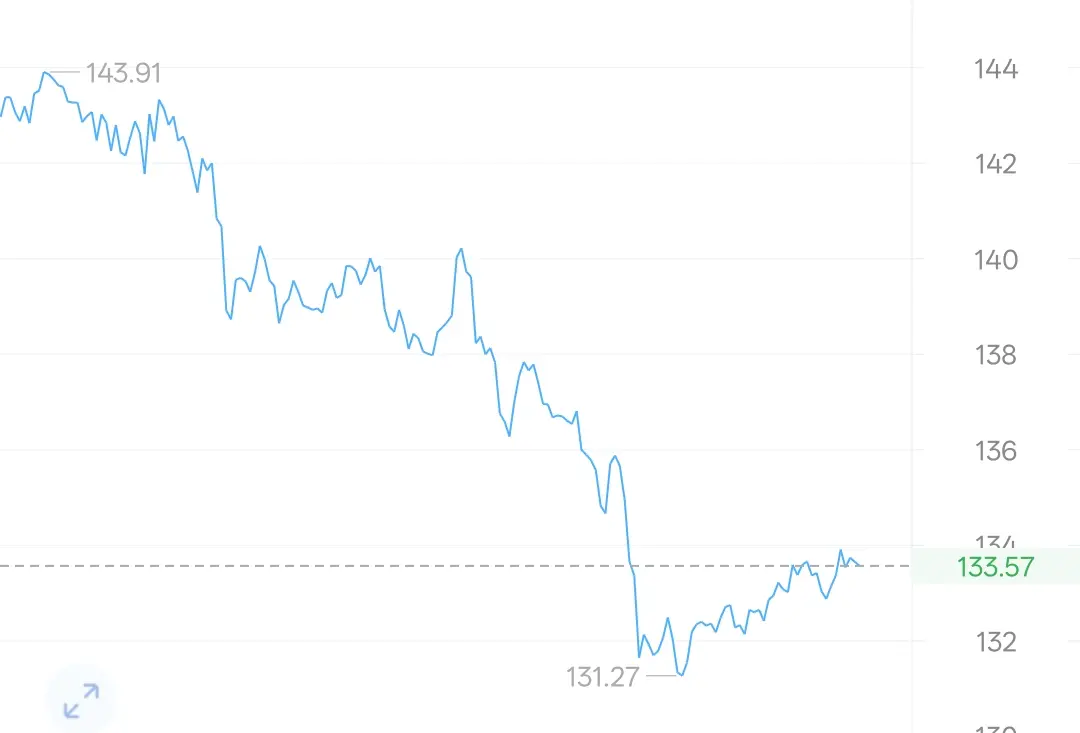
From the perspective of the 1-hour candlestick chart and technical indicators, SOL is showing a weak bottom-finding pattern after a breakdown in the short term. Recently, after surging to 133.93, it quickly pulled back, with a large bearish candlestick breaking through, directly piercing both the middle and lower Bollinger Bands. The price hit a low near 131.2, then rebounded slightly to 131.72, forming a “sharp surge and crash + narrow range consolidation at the lows” bear-dominated pattern, with bearish momentum fully released. The upper band of the Bollinger Bands has
From the perspective of the 1-hour candlestick chart and technical indicators, SOL is showing a weak bottom-finding pattern after a breakdown in the short term. Recently, after surging to 133.93, it quickly pulled back, with a large bearish candlestick breaking through, directly piercing both the middle and lower Bollinger Bands. The price hit a low near 131.2, then rebounded slightly to 131.72, forming a “sharp surge and crash + narrow range consolidation at the lows” bear-dominated pattern, with bearish momentum fully released. The upper band of the Bollinger Bands has
SOL1.53%
MC:$4.33KHolders:3
0.00%
- Reward
- 4
- 2
- Repost
- Share
Warm6688:
Hop on board!🚗View More
Evening of 12.7
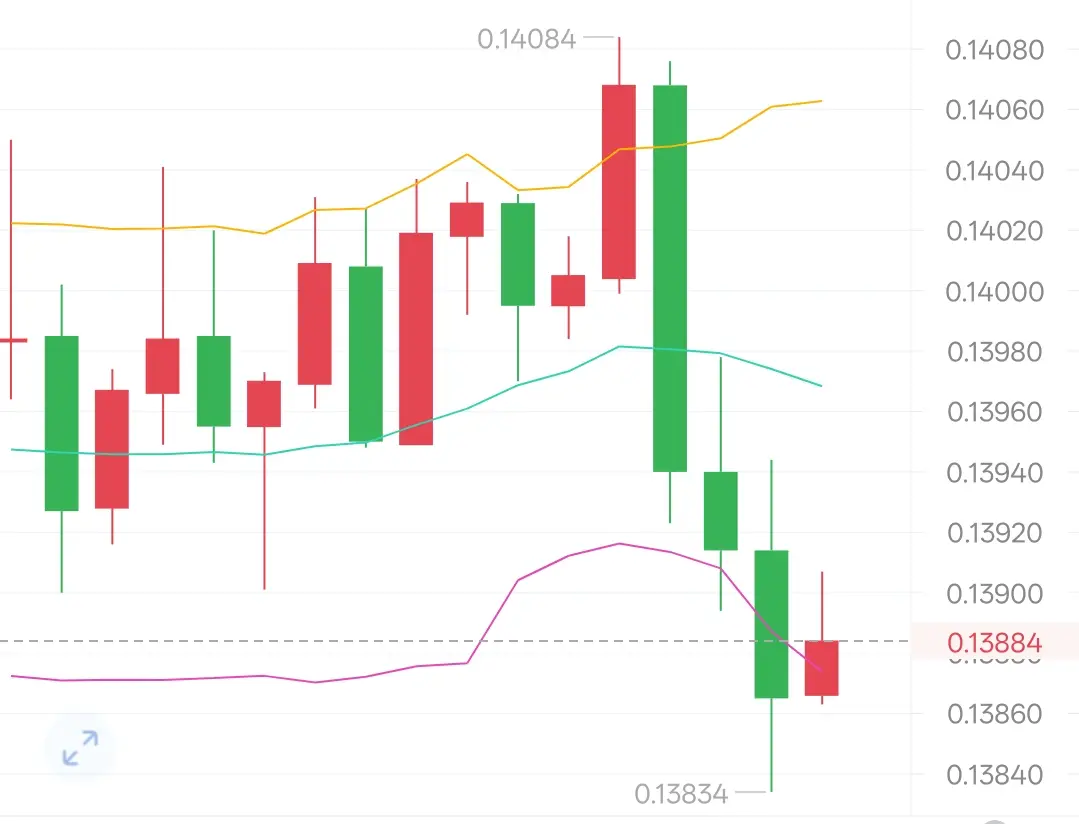
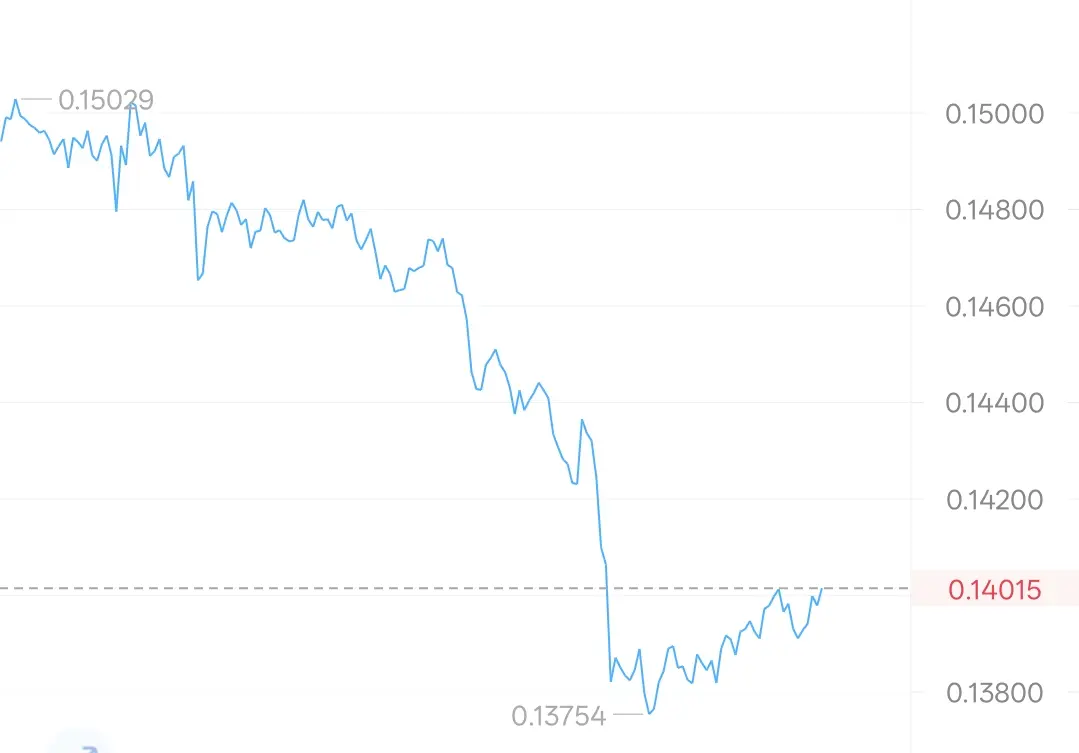
From the 1-hour K-line period and technical indicators, DOGE is showing a weak consolidation pattern after a sharp drop in the short term; the upper band of the Bollinger Bands is turning downward, and the price has broken directly through the middle and lower bands from the upper band, with the bands opening up, indicating that the short-term downward breakout trend has been established. Recently, after surging to 0.1408, DOGE experienced a sharp decline with heavy volume, forming consecutive large bearish candles, directly breaking through the middle and lower Bollinger Bands
From the 1-hour K-line period and technical indicators, DOGE is showing a weak consolidation pattern after a sharp drop in the short term; the upper band of the Bollinger Bands is turning downward, and the price has broken directly through the middle and lower bands from the upper band, with the bands opening up, indicating that the short-term downward breakout trend has been established. Recently, after surging to 0.1408, DOGE experienced a sharp decline with heavy volume, forming consecutive large bearish candles, directly breaking through the middle and lower Bollinger Bands
DOGE1.23%
MC:$4.23KHolders:728
0.07%
- Reward
- 4
- 4
- Repost
- Share
BorrowMoneyToTrade :
:
The analysis is spot-on. Charge, charge, charge! Fried rice, fried rice, eat unless ingredients, ingredients oooView More
Evening of 12.7
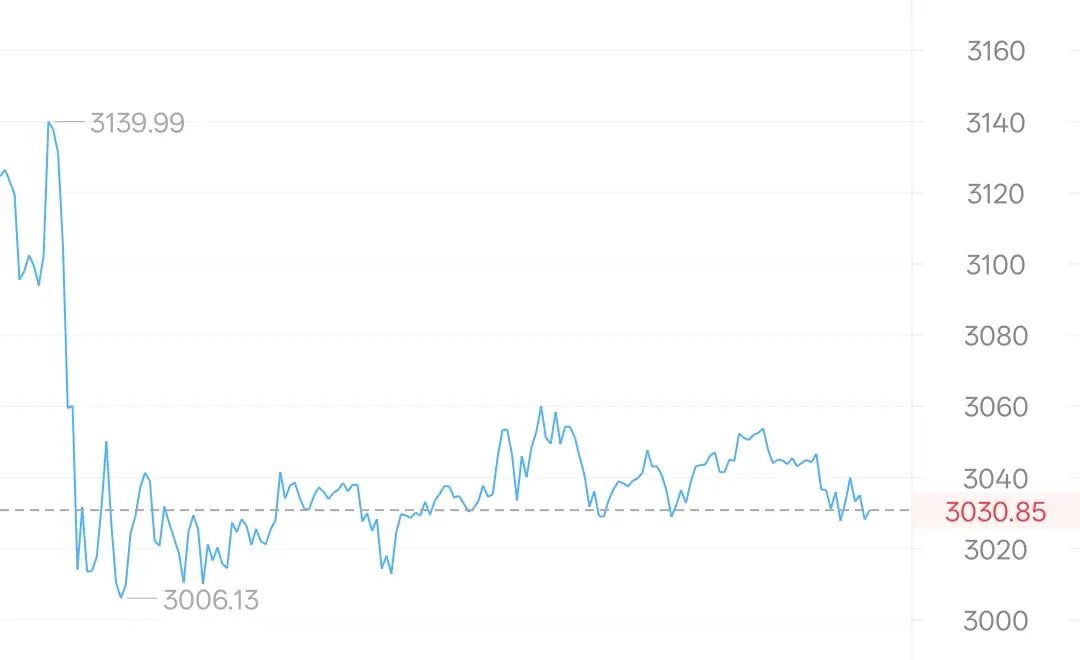
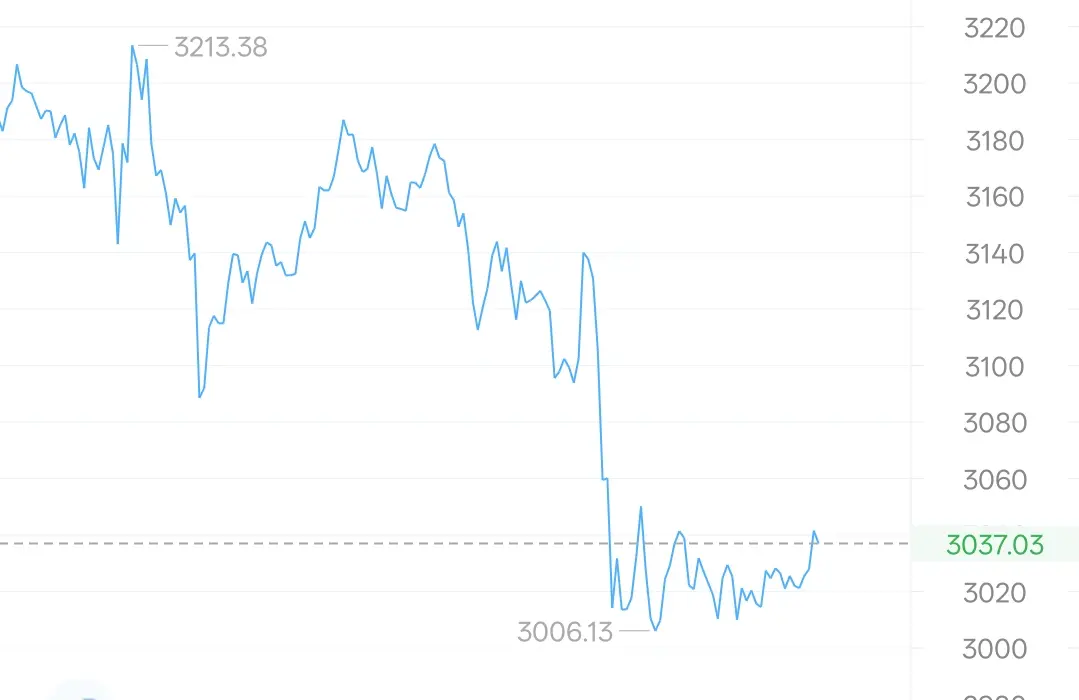
From the perspective of the 1-hour candlestick chart and technical indicators, ETH is showing a weak and volatile downward trend in the short term. Recently, after surging to 3068, the price has continued to fall, with consecutive bearish candles and expanding real bodies, forming a "surge and pullback + consecutive declines" bearish pattern. It has now broken below the middle band of the Bollinger Bands and is between the middle and lower bands, indicating a clear downward trend. The overall Bollinger Bands are flattening and starting to turn downward, with the price retracing
From the perspective of the 1-hour candlestick chart and technical indicators, ETH is showing a weak and volatile downward trend in the short term. Recently, after surging to 3068, the price has continued to fall, with consecutive bearish candles and expanding real bodies, forming a "surge and pullback + consecutive declines" bearish pattern. It has now broken below the middle band of the Bollinger Bands and is between the middle and lower bands, indicating a clear downward trend. The overall Bollinger Bands are flattening and starting to turn downward, with the price retracing
ETH2.15%
MC:$3.56KHolders:4
0.17%
- Reward
- 2
- 1
- Repost
- Share
AAChenHaoyu:
快上车!🚗Evening of 12.7
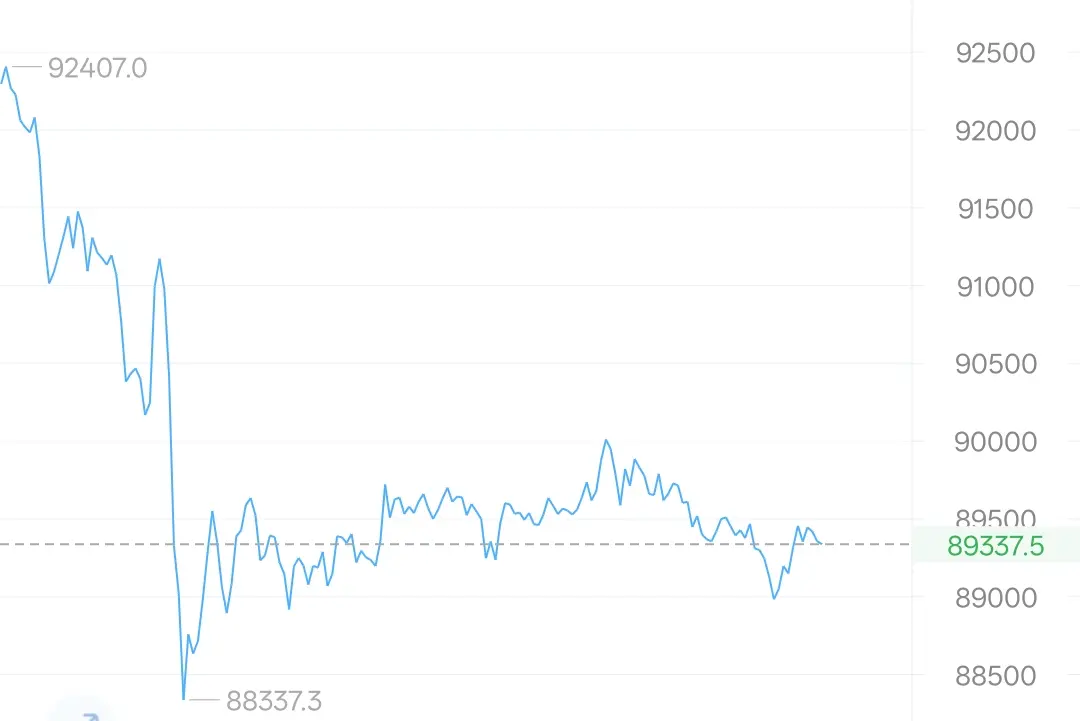
From the 1-hour K-line cycle and technical indicators, Bitcoin is showing a short-term weak pullback trend. Recently, the price surged to 90257 and then quickly retraced, with several consecutive long-bodied bearish candles, forming a "surge and pullback" bearish-dominated pattern. The latest K-line has broken below the middle band of the Bollinger Bands at 89473, currently near the lower band at 89049, indicating strong short-term downward momentum. The price has fallen from the upper band to near the lower band, and the bands are flattening, suggesting that the short-term con
From the 1-hour K-line cycle and technical indicators, Bitcoin is showing a short-term weak pullback trend. Recently, the price surged to 90257 and then quickly retraced, with several consecutive long-bodied bearish candles, forming a "surge and pullback" bearish-dominated pattern. The latest K-line has broken below the middle band of the Bollinger Bands at 89473, currently near the lower band at 89049, indicating strong short-term downward momentum. The price has fallen from the upper band to near the lower band, and the bands are flattening, suggesting that the short-term con
BTC1.33%
MC:$3.42KHolders:2
0.00%
- Reward
- 4
- 3
- Repost
- Share
MinaminoNozomi :
:
It's getting late, what are you still looking at, hahaha, damn, I see you're giving out your phone number step by step.View More
12.7
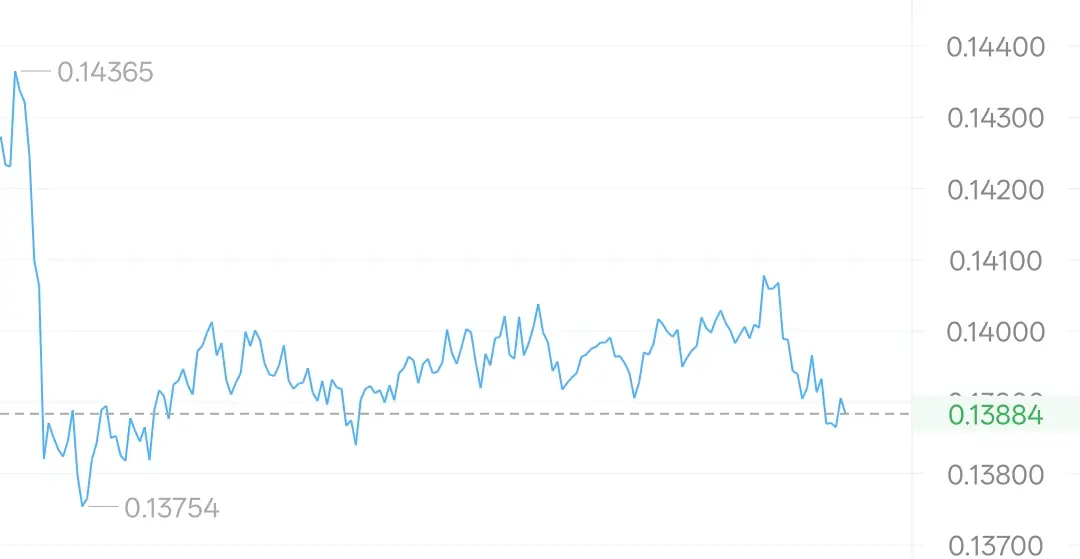
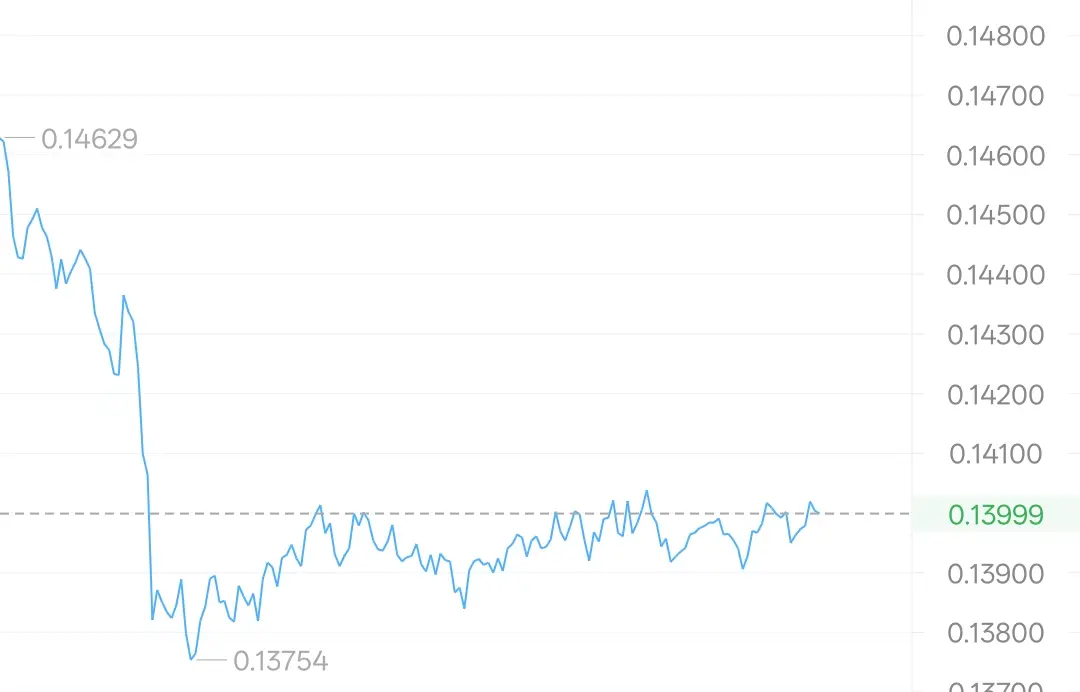
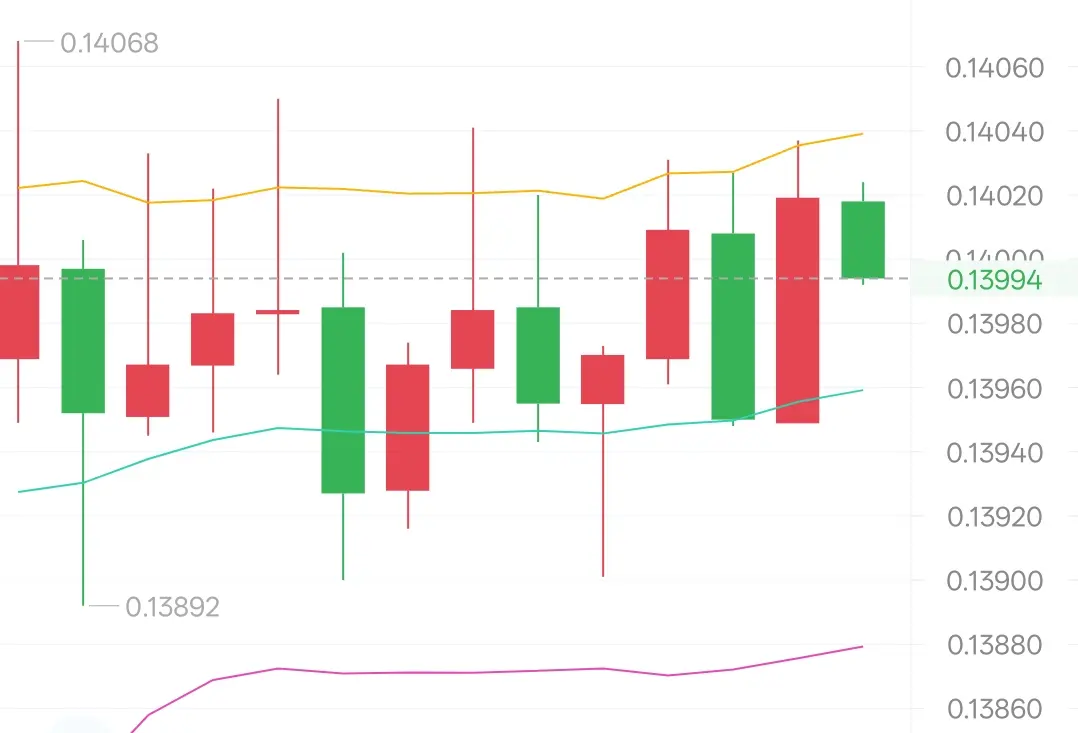
The current price of DOGE is 0.1399. Previously, it surged to 0.1407 before pulling back, and overall it is showing a narrow-range consolidation pattern after a spike and retracement, with the short-term direction still unclear. Currently, it is close to the middle band of the Bollinger Bands, indicating weak volatility near the middle band in the short term, with the middle band acting as immediate support and the upper band as short-term resistance. Recently, the 1-hour candlestick chart has shown long upper shadows after the price spike, followed by small bullish and bearish candles, f
The current price of DOGE is 0.1399. Previously, it surged to 0.1407 before pulling back, and overall it is showing a narrow-range consolidation pattern after a spike and retracement, with the short-term direction still unclear. Currently, it is close to the middle band of the Bollinger Bands, indicating weak volatility near the middle band in the short term, with the middle band acting as immediate support and the upper band as short-term resistance. Recently, the 1-hour candlestick chart has shown long upper shadows after the price spike, followed by small bullish and bearish candles, f
DOGE1.23%
MC:$4.23KHolders:728
0.07%
- Reward
- 1
- 2
- Repost
- Share
GateUser-e52405be:
Everyone, keep a lewd smile. That's an order, everyone!!!!View More
12.7
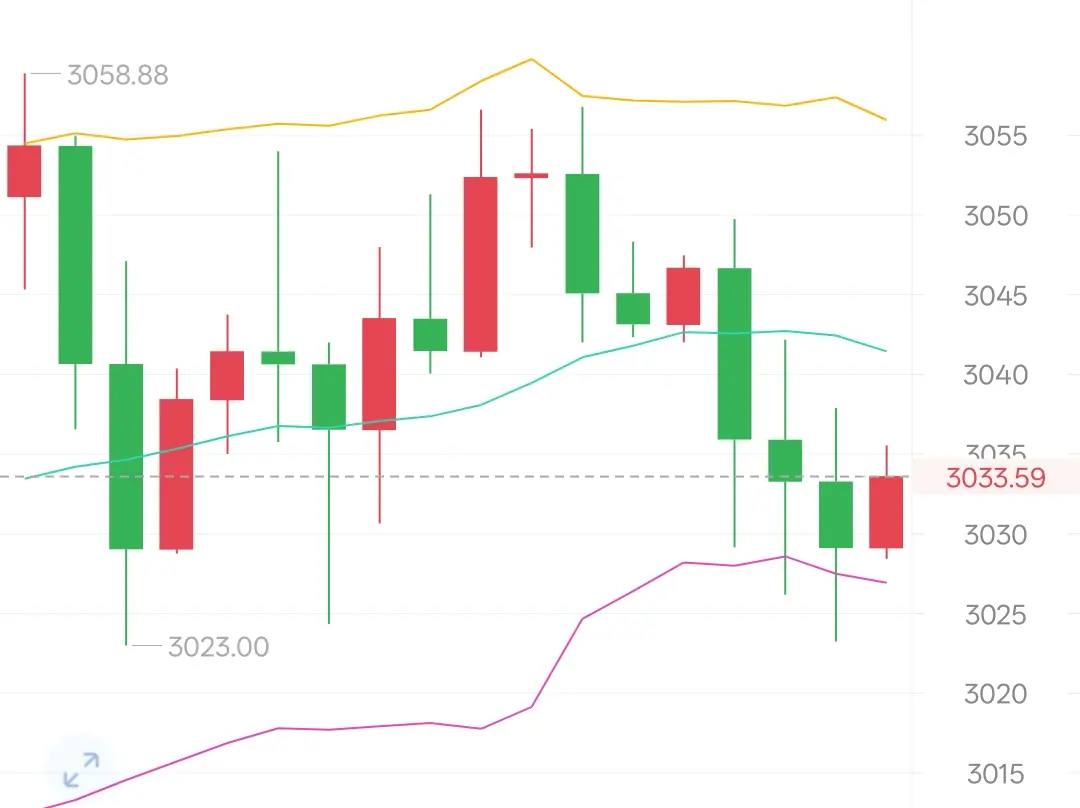
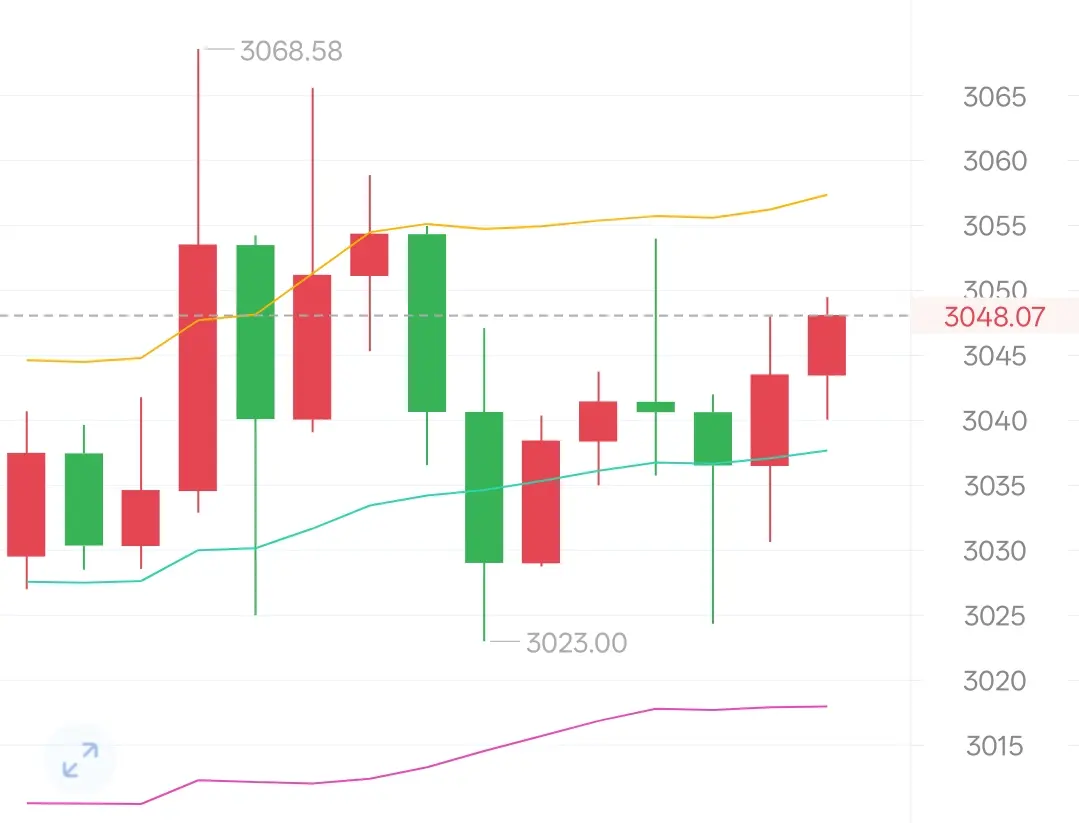
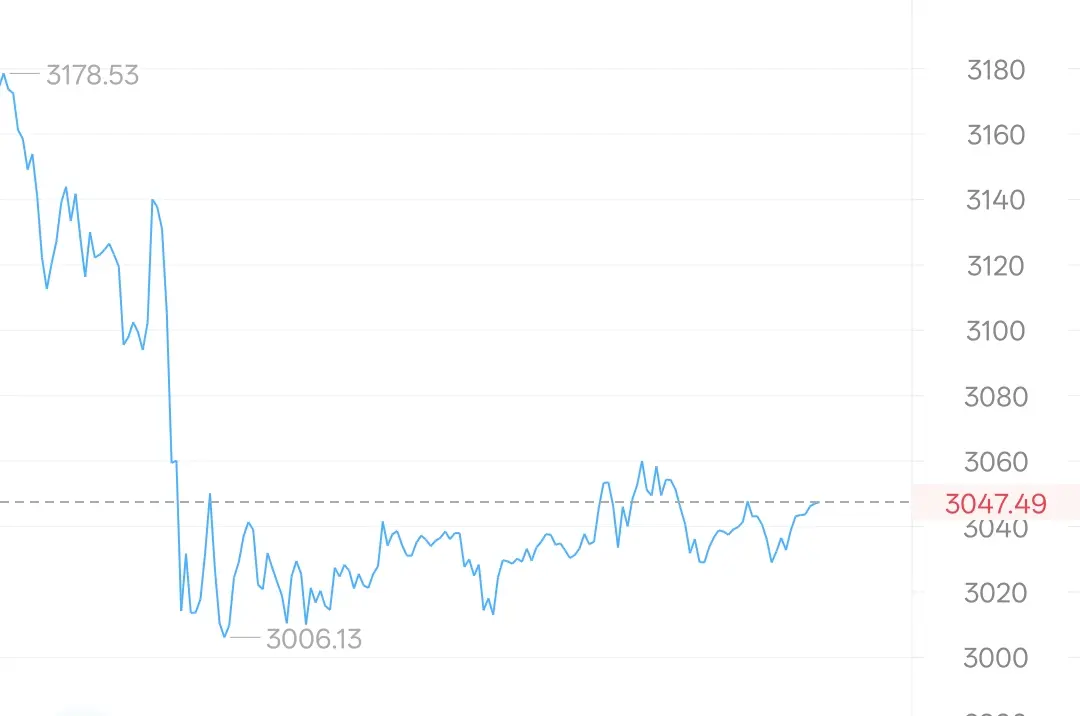
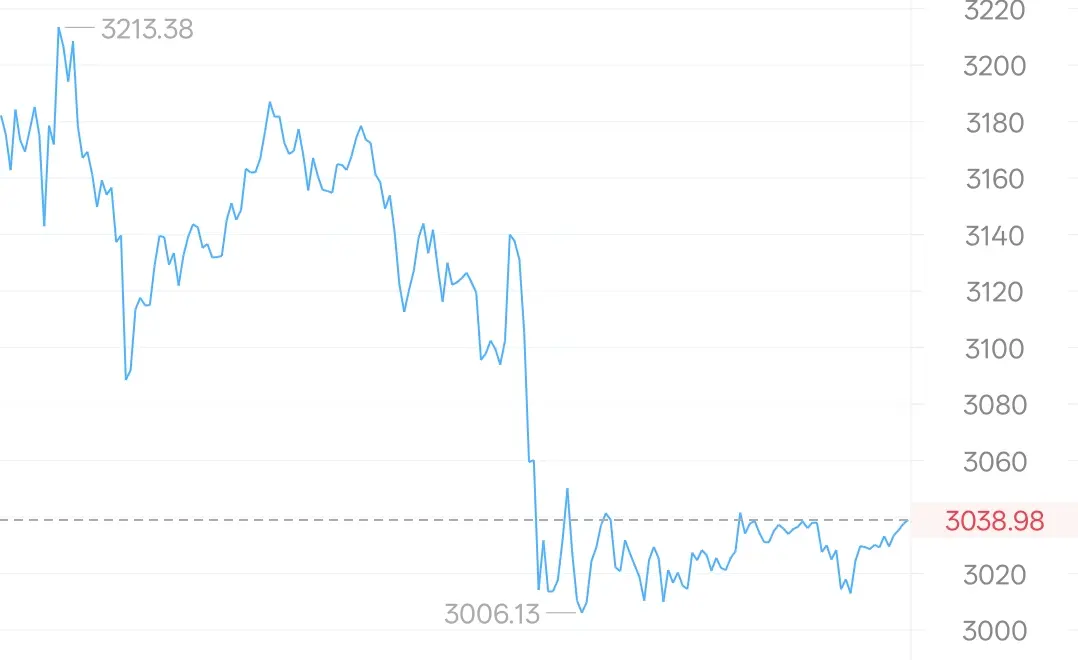
ETH is currently operating at the 3042 level. Previously, it surged to 3068 before pulling back, showing an overall pattern of volatility and stabilization after a spike and retreat. In the short term, it is mainly oscillating and recovering. Recently, on the 1-hour candlestick chart, a long upper shadow surge candlestick appeared first, followed by several small bullish and bearish candlesticks, forming a bottom-building churning pattern, reflecting the tug-of-war between bulls and bears in the 3040-3050 range. There is strong short-term support at 3023 below. After dropping to 3023, it
ETH is currently operating at the 3042 level. Previously, it surged to 3068 before pulling back, showing an overall pattern of volatility and stabilization after a spike and retreat. In the short term, it is mainly oscillating and recovering. Recently, on the 1-hour candlestick chart, a long upper shadow surge candlestick appeared first, followed by several small bullish and bearish candlesticks, forming a bottom-building churning pattern, reflecting the tug-of-war between bulls and bears in the 3040-3050 range. There is strong short-term support at 3023 below. After dropping to 3023, it
ETH2.15%
MC:$3.56KHolders:4
0.17%
- Reward
- 1
- 1
- Repost
- Share
AMillionaireFromTheDeep :
:
Just go for it 💪12.7
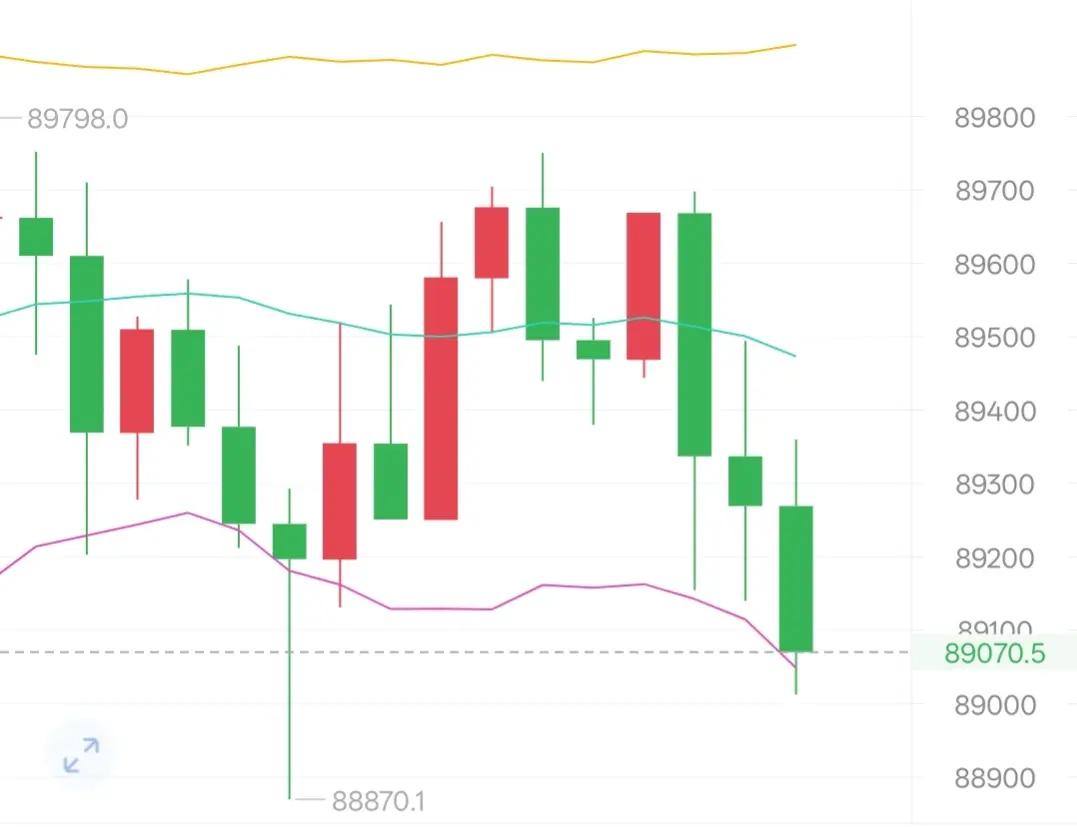
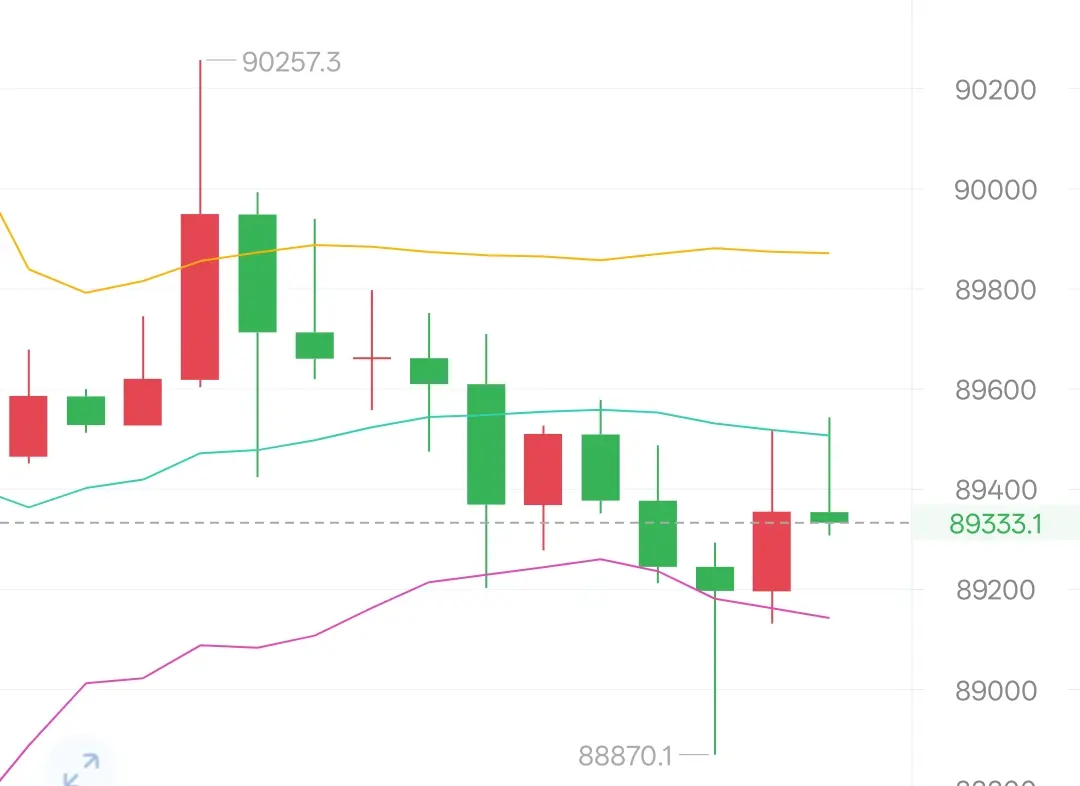
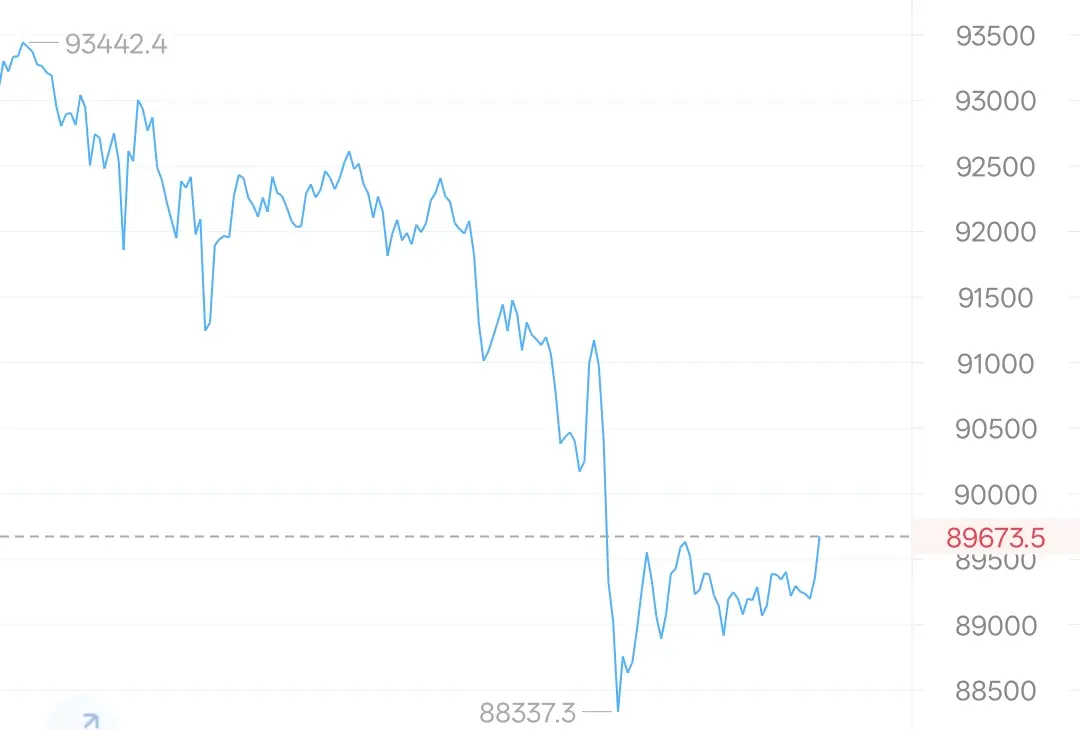
BTC is currently at the 89333 level. Previously, there was a surge followed by a pullback, with the hourly high reaching 90257, then retracing to the current range. Overall, it is showing a short-term pattern of surging and then consolidating with a pullback. Recently, the 1-hour candlestick chart has shown long upper shadow candlesticks after a surge and pullback, followed by several small bearish and bullish candlesticks forming a consolidation pattern, indicating a tug-of-war between bulls and bears at the current price, with no clear direction yet. After previously dipping to 88870 an
BTC is currently at the 89333 level. Previously, there was a surge followed by a pullback, with the hourly high reaching 90257, then retracing to the current range. Overall, it is showing a short-term pattern of surging and then consolidating with a pullback. Recently, the 1-hour candlestick chart has shown long upper shadow candlesticks after a surge and pullback, followed by several small bearish and bullish candlesticks forming a consolidation pattern, indicating a tug-of-war between bulls and bears at the current price, with no clear direction yet. After previously dipping to 88870 an
BTC1.33%
MC:$3.42KHolders:2
0.00%
- Reward
- 1
- 1
- Repost
- Share
AAChenHaoyu:
Stay strong and HODL💎Evening of 12.6
BTC overall structure on the 1-hour K-line shows a high-level oscillation and pullback pattern. After previously surging to 91,445 and quickly pulling back, it has since consolidated in a narrow range between 88,800-89,700. The K-lines are mainly alternating small bullish and bearish candles, which is characteristic of a consolidation and oscillation phase.
The KDJ three lines are above 50, at a medium-high level. Although not yet overbought, the J line is starting to turn downward, indicating a possible short-term pullback. The MACD histogram is positive, but both DIF and DEA
View OriginalBTC overall structure on the 1-hour K-line shows a high-level oscillation and pullback pattern. After previously surging to 91,445 and quickly pulling back, it has since consolidated in a narrow range between 88,800-89,700. The K-lines are mainly alternating small bullish and bearish candles, which is characteristic of a consolidation and oscillation phase.
The KDJ three lines are above 50, at a medium-high level. Although not yet overbought, the J line is starting to turn downward, indicating a possible short-term pullback. The MACD histogram is positive, but both DIF and DEA
MC:$3.42KHolders:2
0.00%
- Reward
- 1
- 1
- Repost
- Share
AAChenHaoyu:
Just go for it 💪12.6
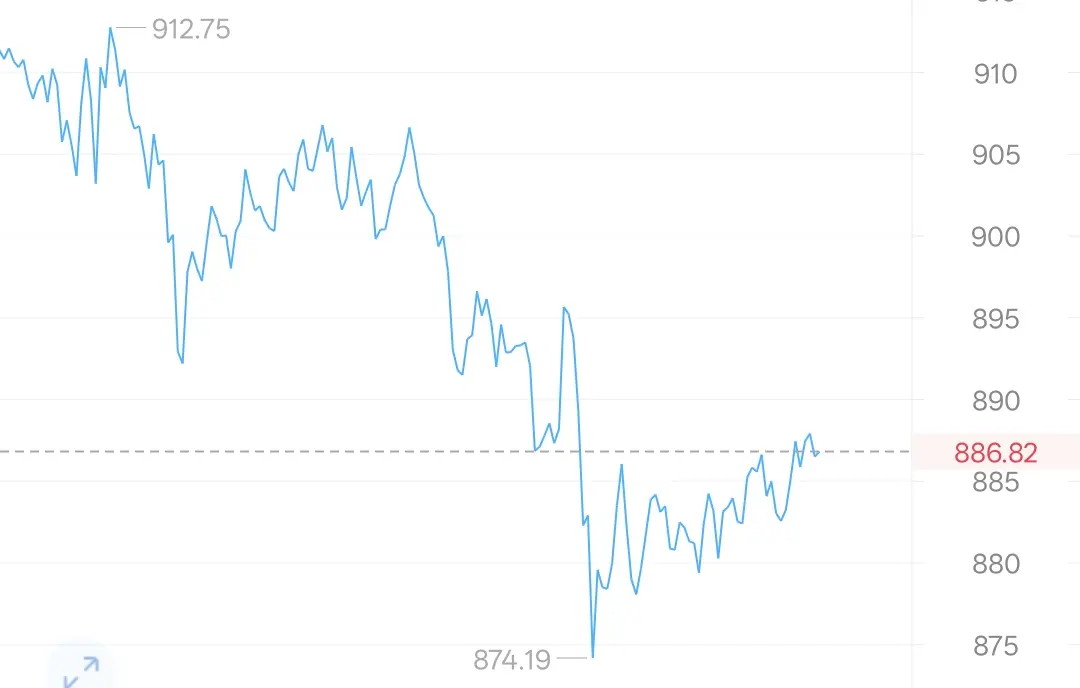
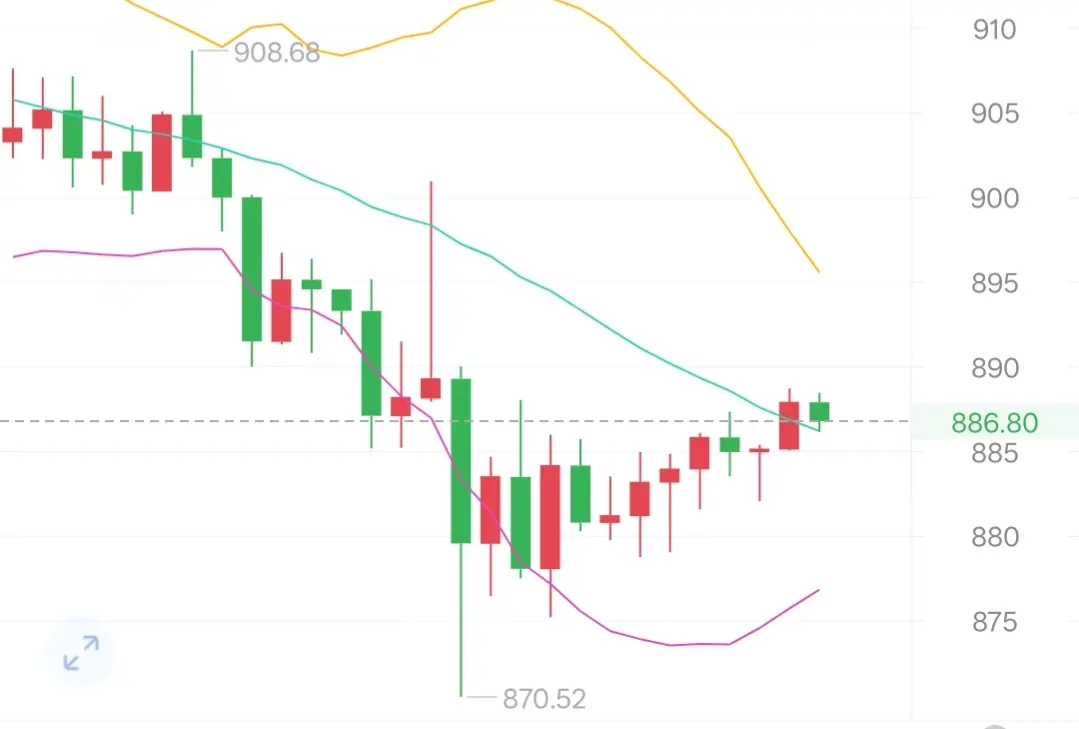
BNB is currently operating at the 886.5 level, closely aligned with the middle band of the Bollinger Bands. The upper band is trending downward while the lower band is flattening out. After a sharp drop earlier, the price has entered a weak rebound phase, with the bearish trend still dominating. Recently, the candlestick structure showed a sharp drop with a long bearish candle hitting a bottom at 870.52, followed by a pattern of alternating small bullish and bearish candles, indicating a low-level consolidation rebound. The absence of consecutive strong bullish candles suggests that the b
BNB is currently operating at the 886.5 level, closely aligned with the middle band of the Bollinger Bands. The upper band is trending downward while the lower band is flattening out. After a sharp drop earlier, the price has entered a weak rebound phase, with the bearish trend still dominating. Recently, the candlestick structure showed a sharp drop with a long bearish candle hitting a bottom at 870.52, followed by a pattern of alternating small bullish and bearish candles, indicating a low-level consolidation rebound. The absence of consecutive strong bullish candles suggests that the b
BNB1.06%
MC:$3.6KHolders:4
0.00%
- Reward
- 2
- 1
- Repost
- Share
AAChenHaoyu:
Stay strong and HODL💎12.6
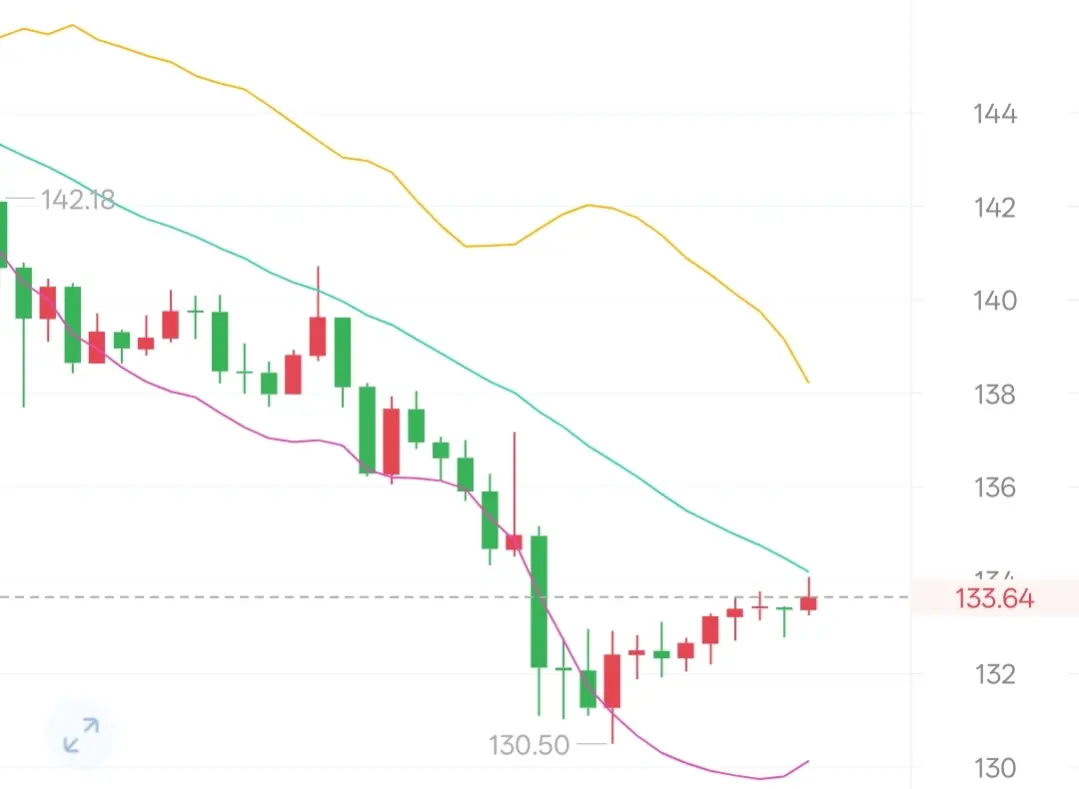
SOL is currently operating at the 133.55 level. Recently, the candlestick pattern first showed a series of sharp declines with large bearish candles, bottoming out at 130.5. This was followed by a low-level rebound consolidation pattern with alternating small bullish and bearish candles, with no sustained strong bullish surge, indicating that the bulls are only making a technical rebound after being oversold, and the strength of the counterattack is insufficient. It is now below the middle band of the Bollinger Bands, with the upper band trending downward and the lower band flattening out
SOL is currently operating at the 133.55 level. Recently, the candlestick pattern first showed a series of sharp declines with large bearish candles, bottoming out at 130.5. This was followed by a low-level rebound consolidation pattern with alternating small bullish and bearish candles, with no sustained strong bullish surge, indicating that the bulls are only making a technical rebound after being oversold, and the strength of the counterattack is insufficient. It is now below the middle band of the Bollinger Bands, with the upper band trending downward and the lower band flattening out
SOL1.53%
MC:$4.33KHolders:3
0.00%
- Reward
- 2
- 4
- Repost
- Share
GateUser-d10f5768:
快上车!🚗View More
12.6
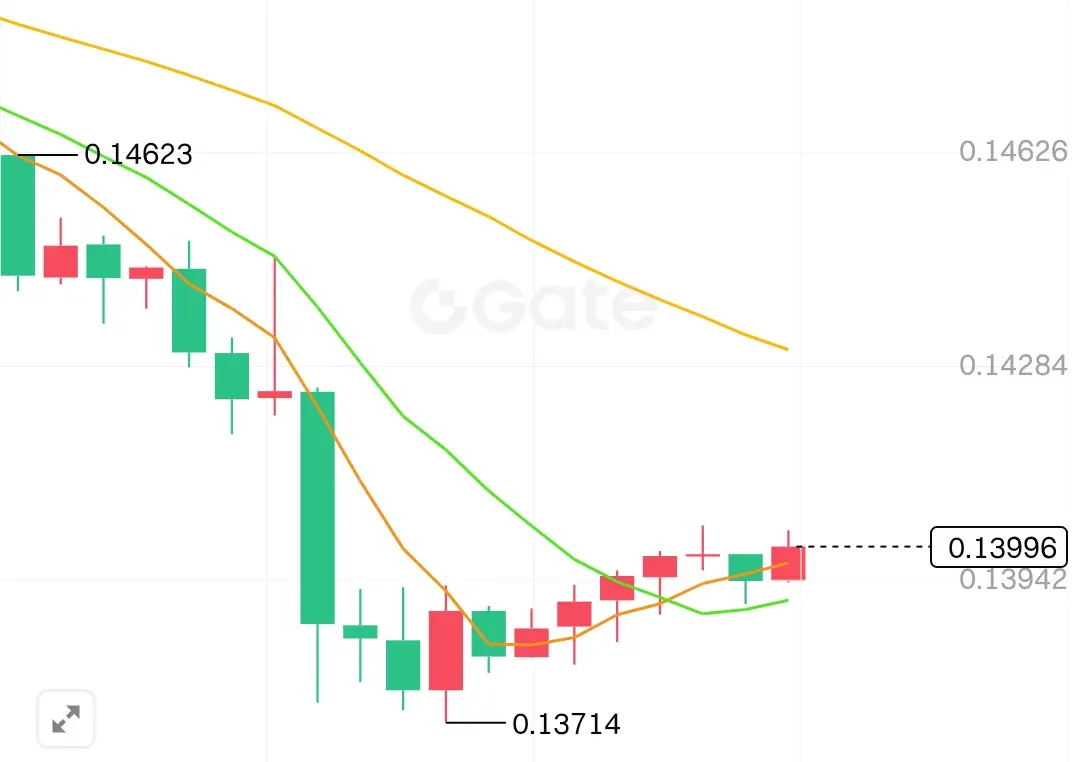
DOGE on the current 1-hour timeframe: The candlestick structure shows a sharp drop with a large bearish candle touching the bottom at the 0.13712 level, followed by a low-level rebound consolidation pattern with alternating small bullish and bearish candles. There is no continuous strong bullish rally, indicating that the bulls are only making a technical rebound after an oversold condition, with weak counterattack strength. Currently, it is operating around the 0.140 level, down 4.92%. The price is near the middle band of the Bollinger Bands, with the upper band turning downward and the
DOGE on the current 1-hour timeframe: The candlestick structure shows a sharp drop with a large bearish candle touching the bottom at the 0.13712 level, followed by a low-level rebound consolidation pattern with alternating small bullish and bearish candles. There is no continuous strong bullish rally, indicating that the bulls are only making a technical rebound after an oversold condition, with weak counterattack strength. Currently, it is operating around the 0.140 level, down 4.92%. The price is near the middle band of the Bollinger Bands, with the upper band turning downward and the
DOGE1.23%
MC:$4.23KHolders:728
0.07%
- Reward
- 3
- 1
- Repost
- Share
AAChenHaoyu:
冲就完了💪12.6
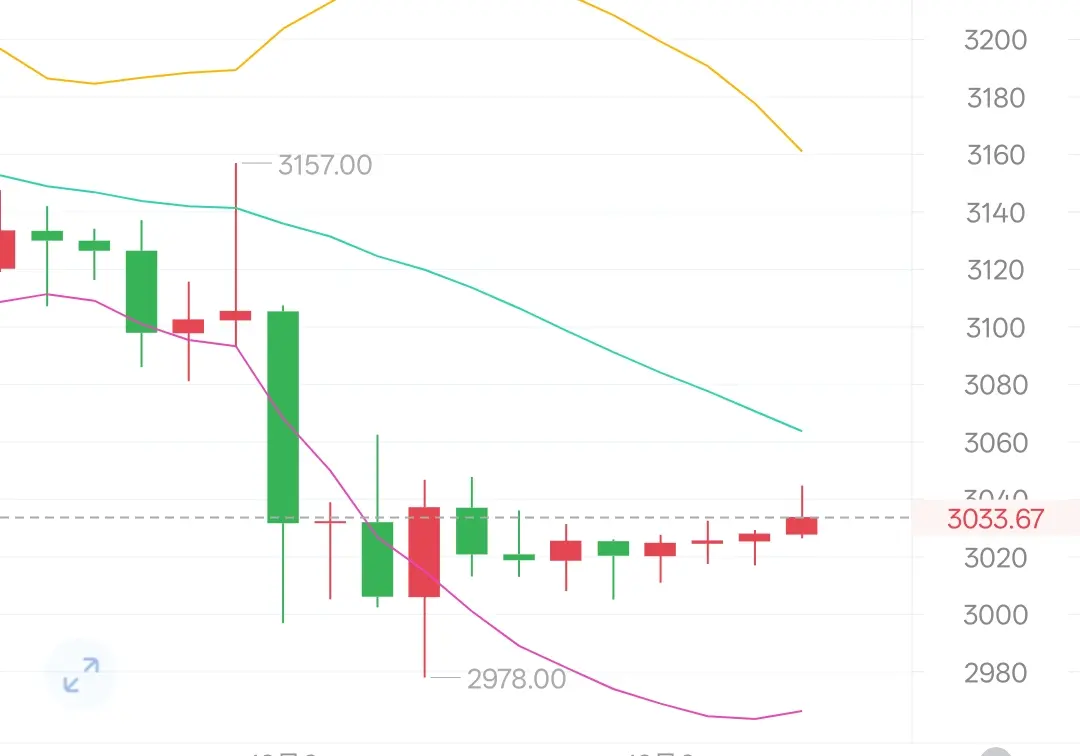
The recent ETH candlestick structure shows a low-level sideways consolidation with small bearish and bullish candles after bottoming out at 2978. There has been no strong bullish breakout, indicating that the bullish rebound is very weak and this is a weak consolidation after a decline, rather than a trend reversal. The current price is at 3037, down 4.16%, and is below the middle band of the Bollinger Bands. The upper band is trending downward, the lower band is flattening, and the short-term market is dominated by bears, only showing a weak stabilization after an oversold condition.
The
ETH2.15%
MC:$3.56KHolders:4
0.17%
- Reward
- 1
- 1
- Repost
- Share
AAChenHaoyu:
👍12.6
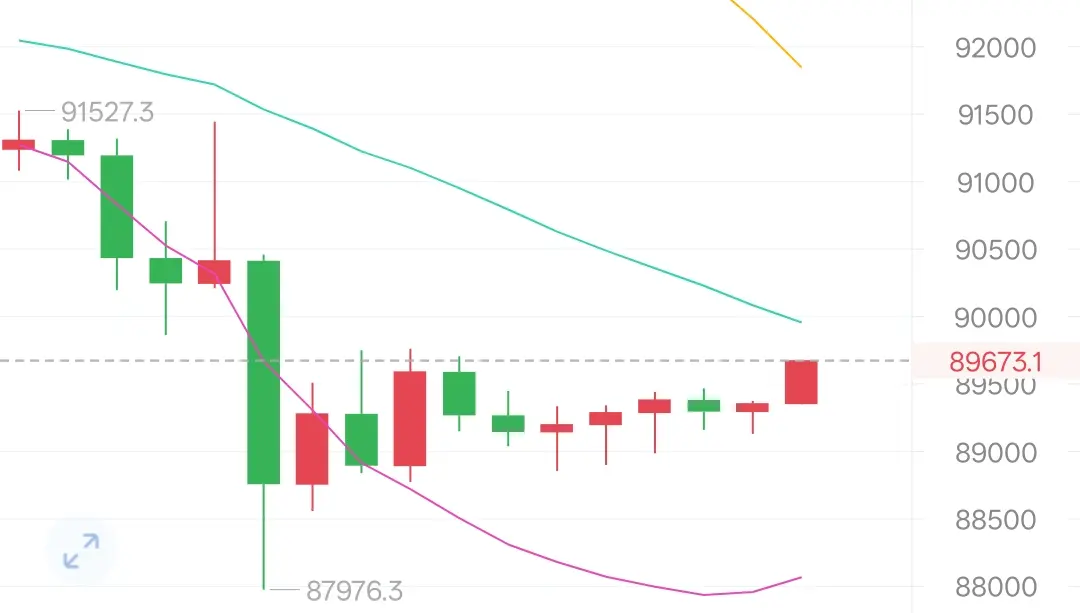
Currently, on the 1-hour candlestick chart, after the price bottomed at 87976, BTC has shown a low-level sideways consolidation with alternating small bearish and bullish candles, without any significant bullish surge. This indicates that the bullish rebound is weak and represents a weak stabilization after a decline. The price is now oscillating sideways between the middle and lower bands of the Bollinger Bands, with the upper band sloping downward and the lower band flattening out, showing short-term bearish characteristics.
KDJ: K=50.1, D=43.4, J=63.4. The J line is above 50 but not ov
BTC1.33%
MC:$3.64KHolders:2
0.00%
- Reward
- 1
- 1
- 2
- Share
AAChenHaoyu:
👍Morning of 12.5
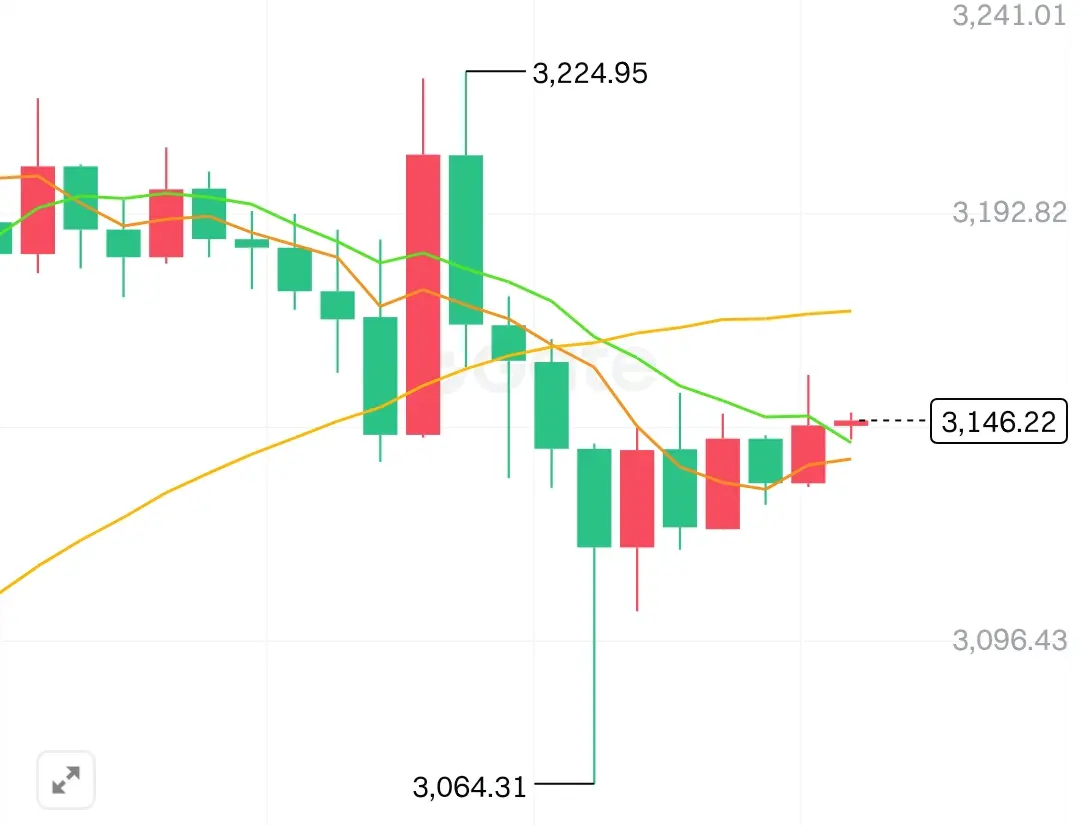
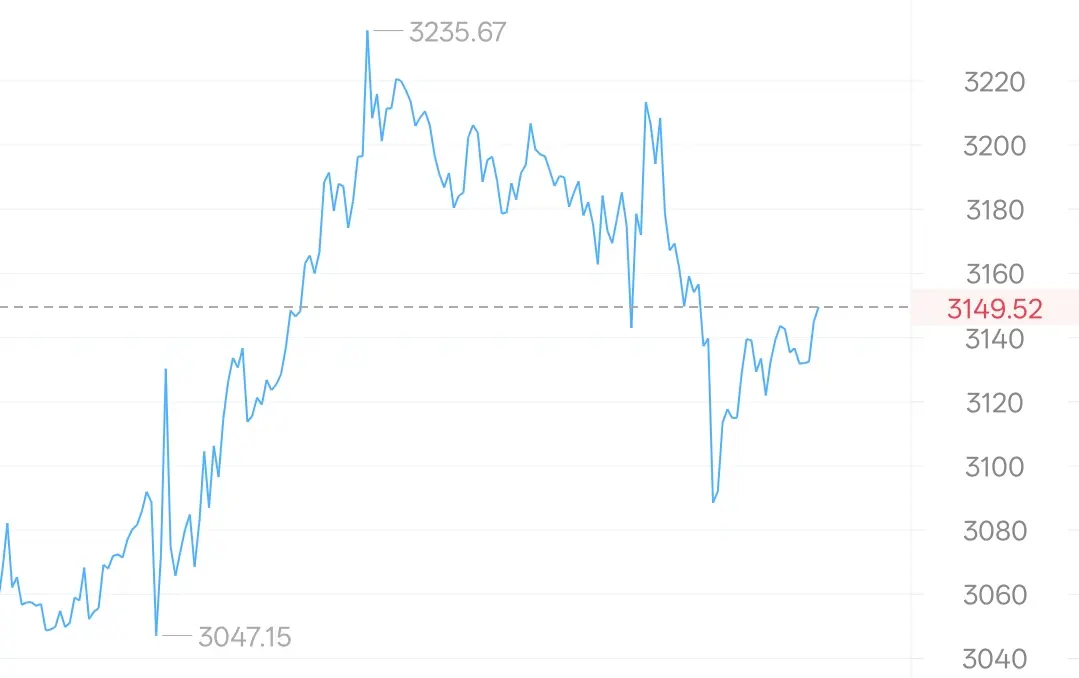
From the 1-hour ETH chart and technical indicators, the short term is in a weak rebound phase after a decline, with the overall trend still bearish. The rebound momentum is limited, and the candlesticks show a sharp drop followed by weak recovery. Previously, after surging to 3227, the price quickly dropped to a low of 3064, forming a long bearish candlestick, followed by a series of small bullish and bearish oscillating candles, typical of a weak recovery after a decline, without any reversal bullish candlestick pattern. The resistance is obvious, and the price failed to break
From the 1-hour ETH chart and technical indicators, the short term is in a weak rebound phase after a decline, with the overall trend still bearish. The rebound momentum is limited, and the candlesticks show a sharp drop followed by weak recovery. Previously, after surging to 3227, the price quickly dropped to a low of 3064, forming a long bearish candlestick, followed by a series of small bullish and bearish oscillating candles, typical of a weak recovery after a decline, without any reversal bullish candlestick pattern. The resistance is obvious, and the price failed to break
ETH2.15%
MC:$3.56KHolders:4
0.17%
- Reward
- 1
- 4
- Repost
- Share
GateUser-45118f5a :
:
Sesame opens the door to welcome good fortune! May peace guard you always, opportunities arrive as expected, your career flourish, your life be fulfilled and smooth, and behind every door lies joy and glory.View More
Morning of 12.5
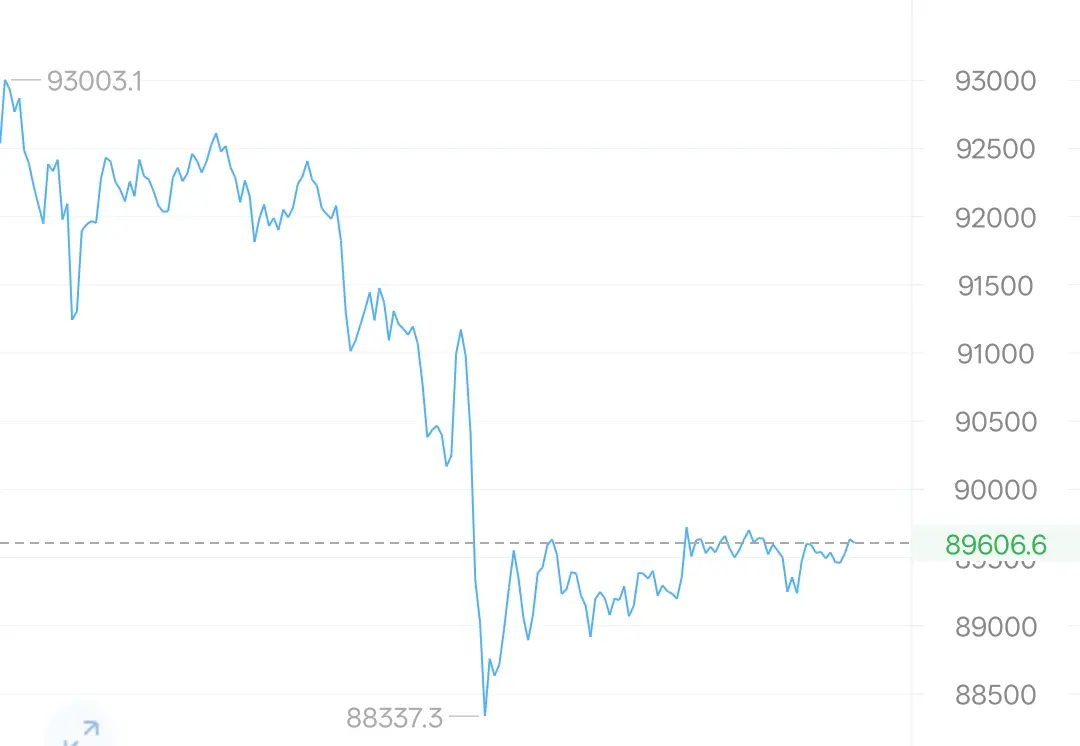
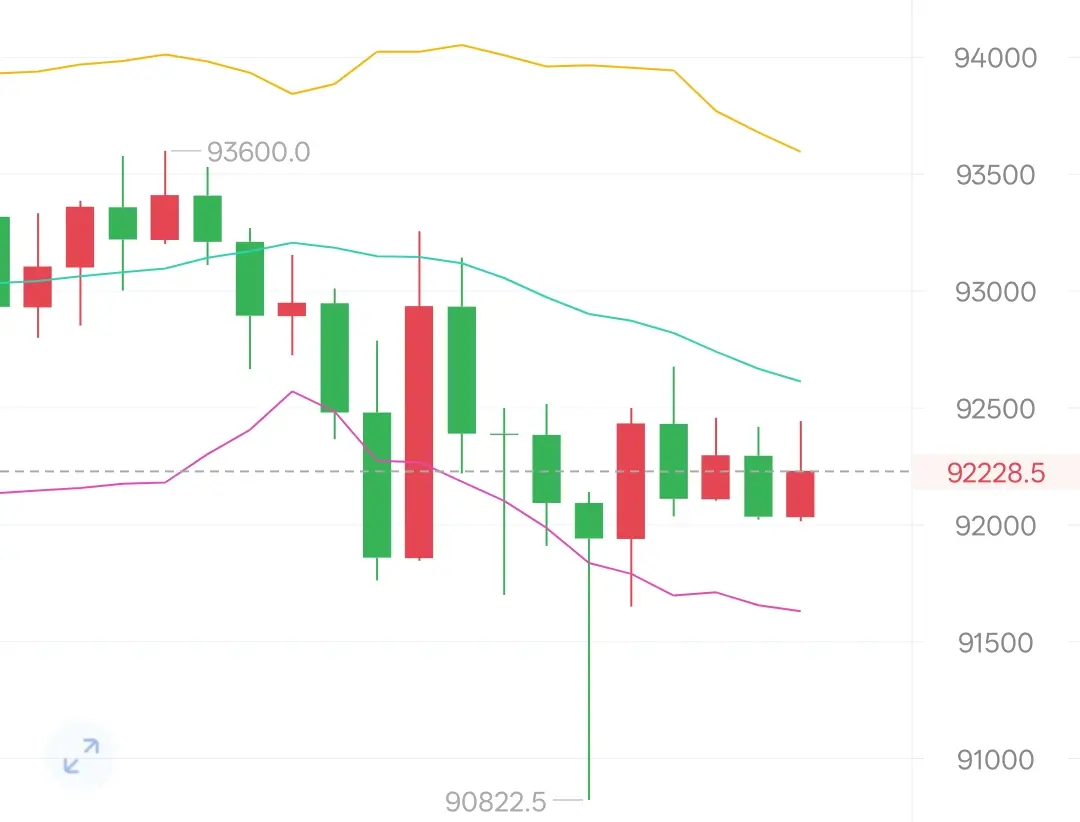
From the 1-hour chart and technical indicators, BTC is showing a short-term weak consolidation with a higher probability of testing support on the downside. Recently, it has formed a pattern of rising and then gradually declining. After hitting the high of 94185, the price has continued to close with bearish candles, breaking below the Bollinger Bands middle line at 92618 and forming a series of consecutive declining candles, indicating that short-term bullish momentum is exhausted and bears have taken the initiative. In addition, there has been a period of low-level consolidat
From the 1-hour chart and technical indicators, BTC is showing a short-term weak consolidation with a higher probability of testing support on the downside. Recently, it has formed a pattern of rising and then gradually declining. After hitting the high of 94185, the price has continued to close with bearish candles, breaking below the Bollinger Bands middle line at 92618 and forming a series of consecutive declining candles, indicating that short-term bullish momentum is exhausted and bears have taken the initiative. In addition, there has been a period of low-level consolidat
BTC1.33%

MC:$3.42KHolders:2
0.00%
- Reward
- 1
- 1
- Repost
- Share
AAChenHaoyu:
5Evening of 12.4
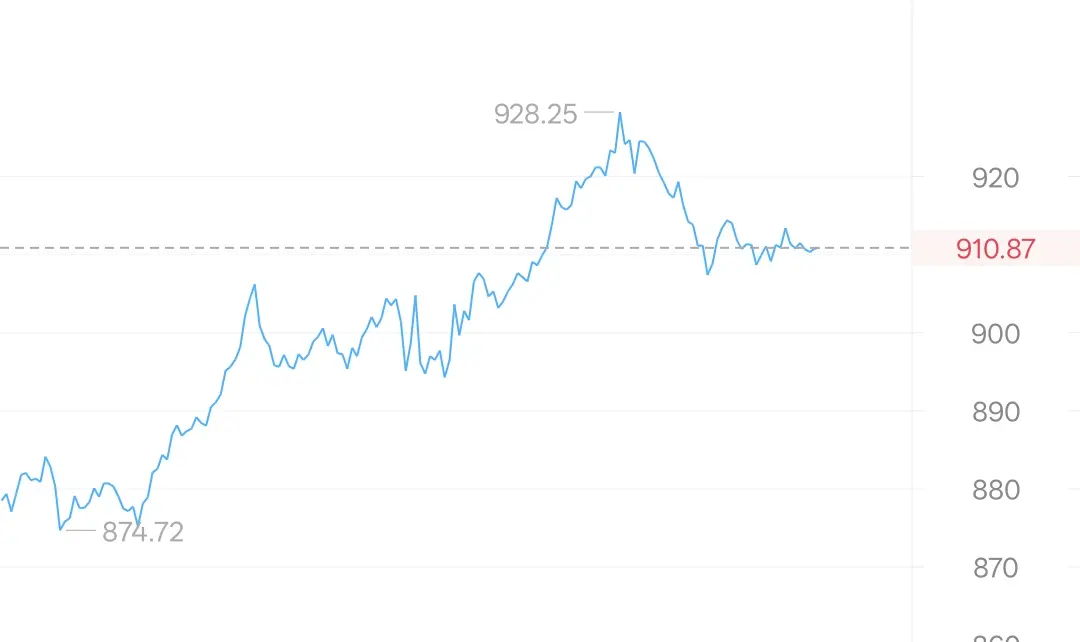
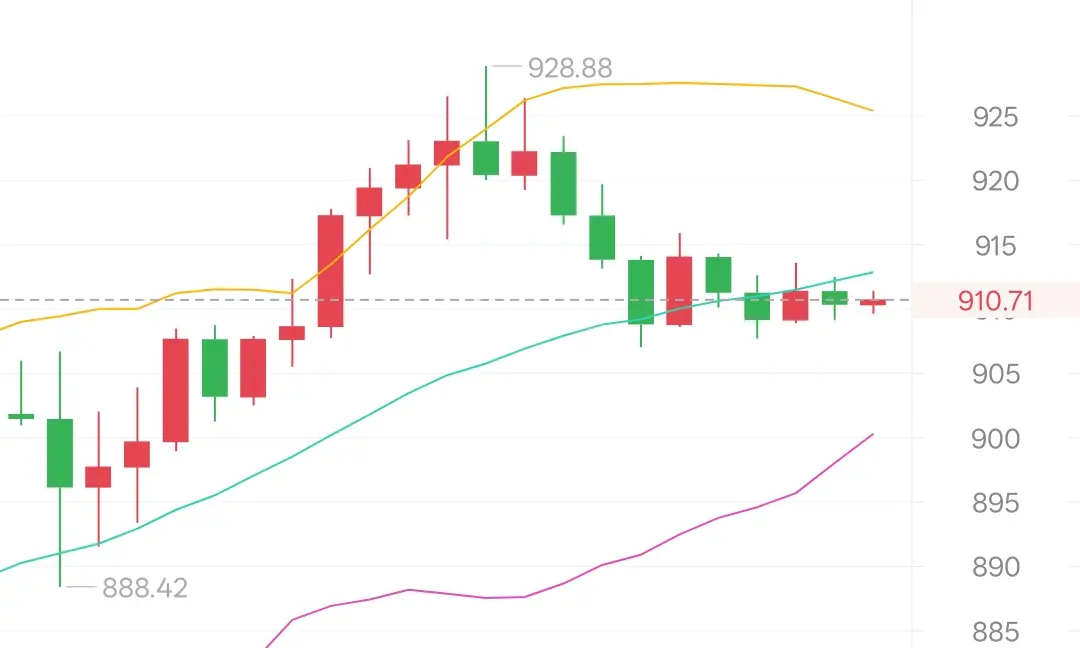
The current BNB candlestick pattern is a consolidation after a surge and pullback. On the 1-hour chart, there was a surge with high volume followed by a pullback on lower volume. Previously, the price quickly rose from 888.42 to the intraday high of 928.88, then retraced with small bearish and bullish candles on decreasing volume, indicating profit-taking after the rise and a period of range-bound volatility. Recently, candlesticks have been fluctuating between the 910-915 range, without any significant breakout, and overall are in a consolidation phase within an uptrend.
Curre
BNB1.06%
- Reward
- 1
- Comment
- Repost
- Share
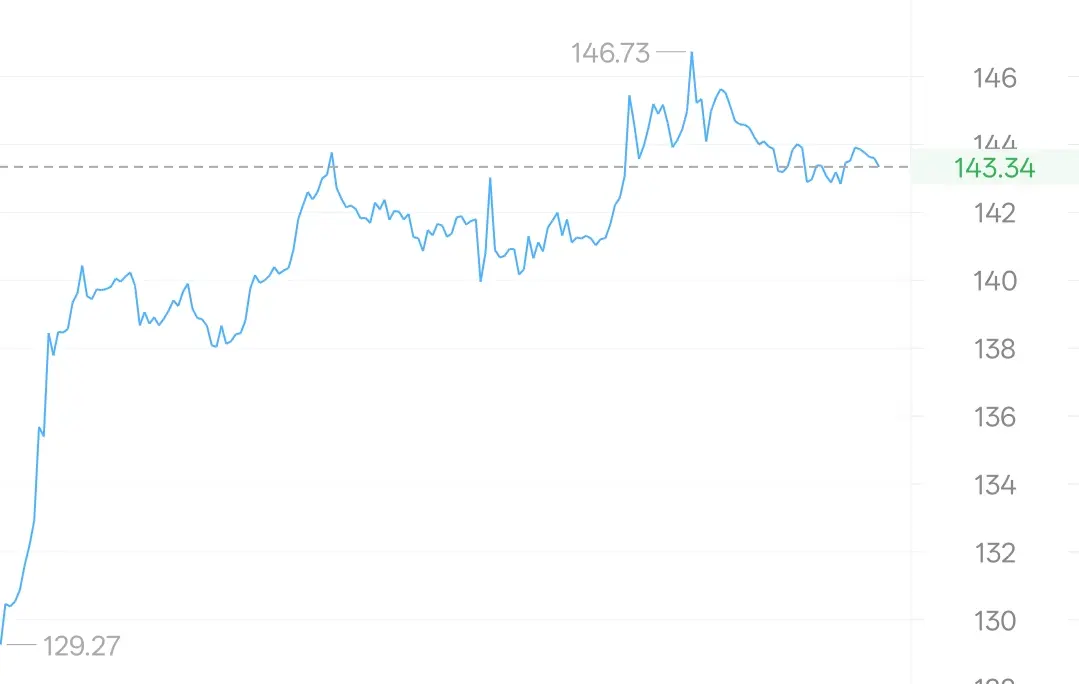
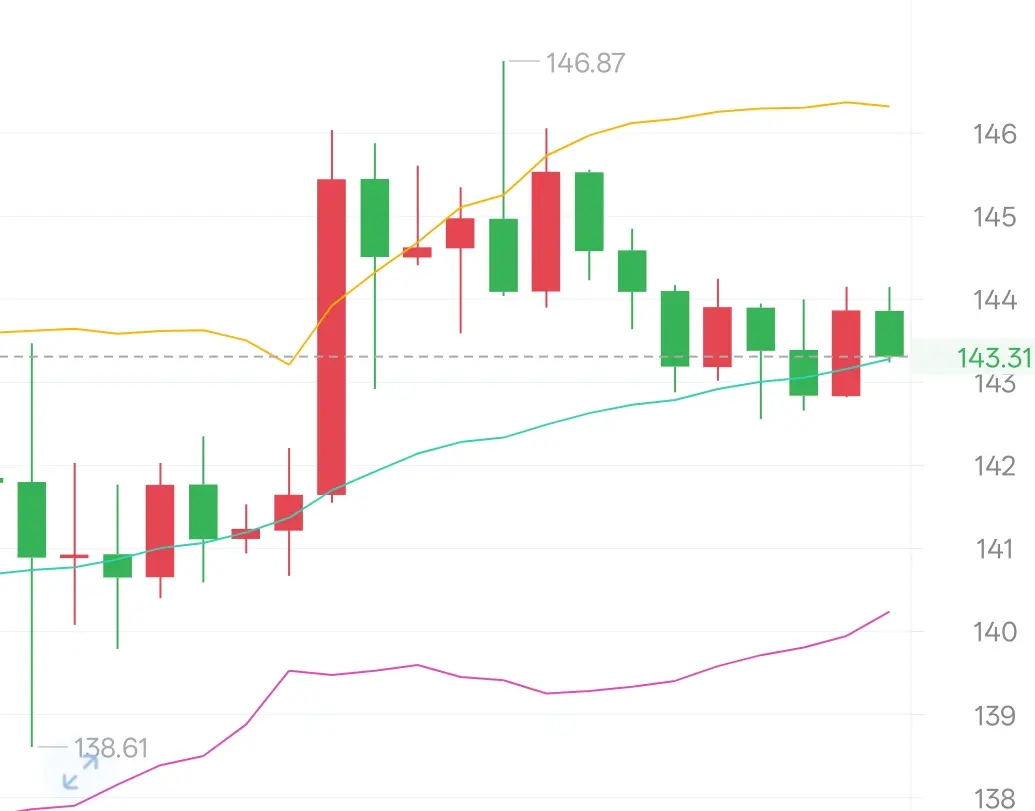
Evening of December 4
The current SOL candlestick pattern shows a consolidation and recovery after a surge and pullback. On the 1-hour chart, there is a pattern of high-volume surge followed by low-volume correction. Previously, the price rapidly climbed from 138.61 to the intraday high of 146.87, then retraced in a low-volume consolidation with small bullish and bearish candles, indicating profit-taking and consolidation after the rise. Recently, candlesticks have been fluctuating around the 143-144 range without significant breakdowns, and bullish momentum remains supported.
Currently, the p
SOL1.53%
MC:$4.33KHolders:3
0.00%
- Reward
- 1
- 1
- Repost
- Share
WolfMouthEatsMeat :
:
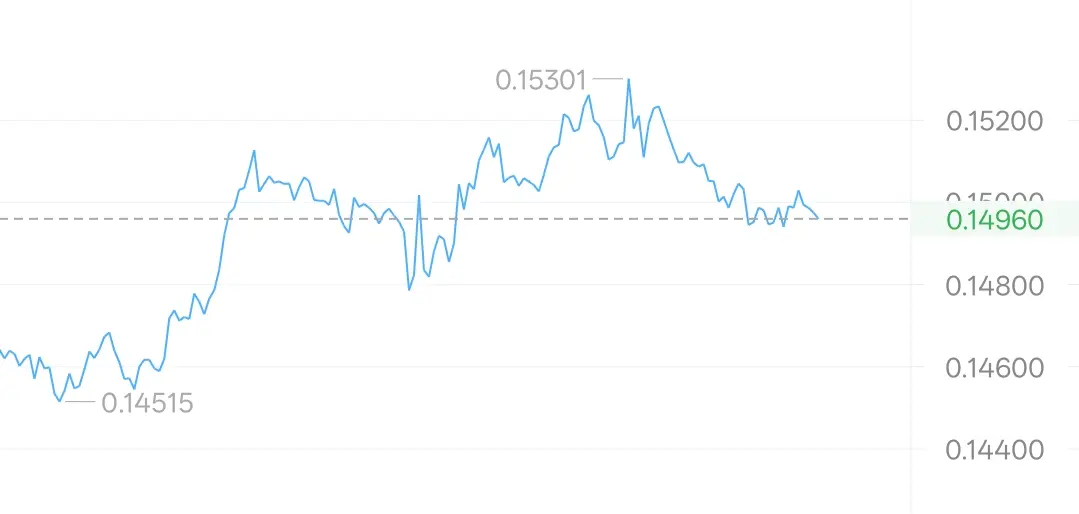
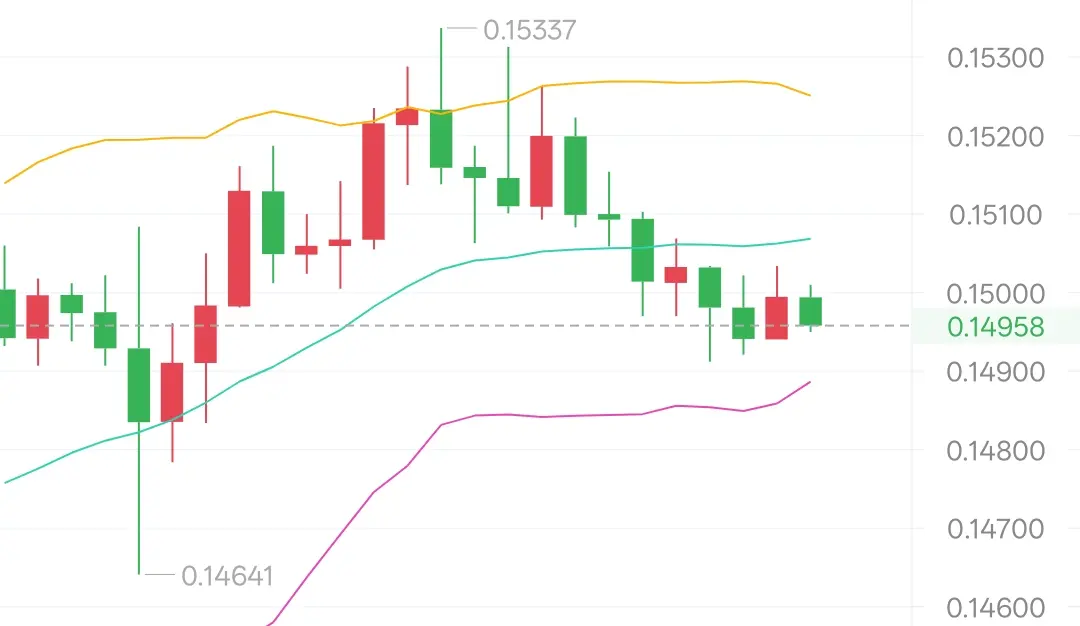
Hop on board!🚗Evening of December 4
The current DOGE candlestick pattern shows consolidation after a surge and pullback. On the 1-hour chart, it’s exhibiting a pattern of rallying and then encountering resistance, followed by a low-volume pullback. Previously, it rapidly climbed from 0.14641 to the intraday high of 0.15337, then continued to retreat, with recent candles mainly being small bearish and bullish lines on reduced volume. It is currently oscillating around the 0.1500 mark, which is a stage of profit-taking and range consolidation after an upward move.
Currently, it is below the middle band of the
DOGE1.23%
MC:$4.23KHolders:728
0.07%
- Reward
- 4
- 1
- Repost
- Share
GateUser-9cf9e527:
I believe in growthEvening of 12.4
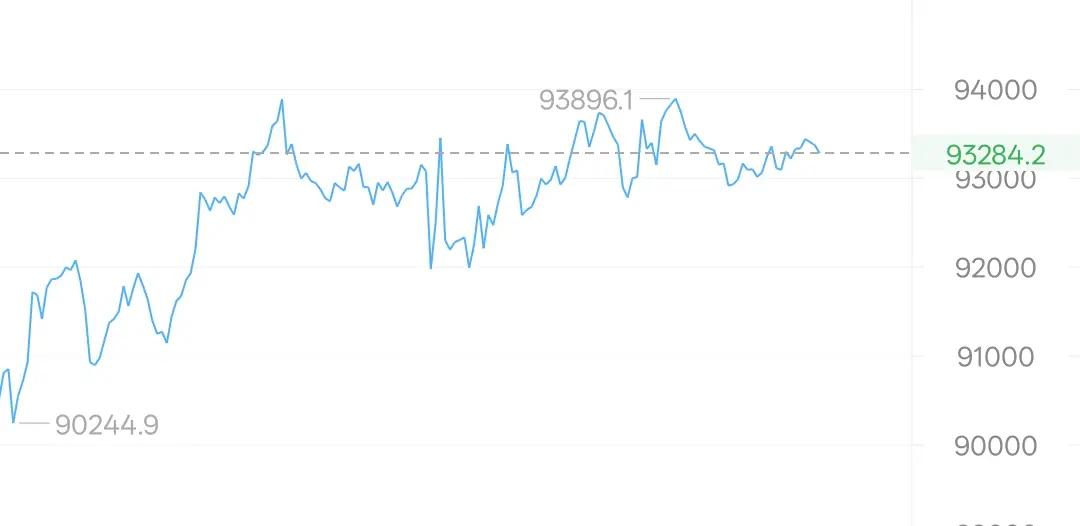
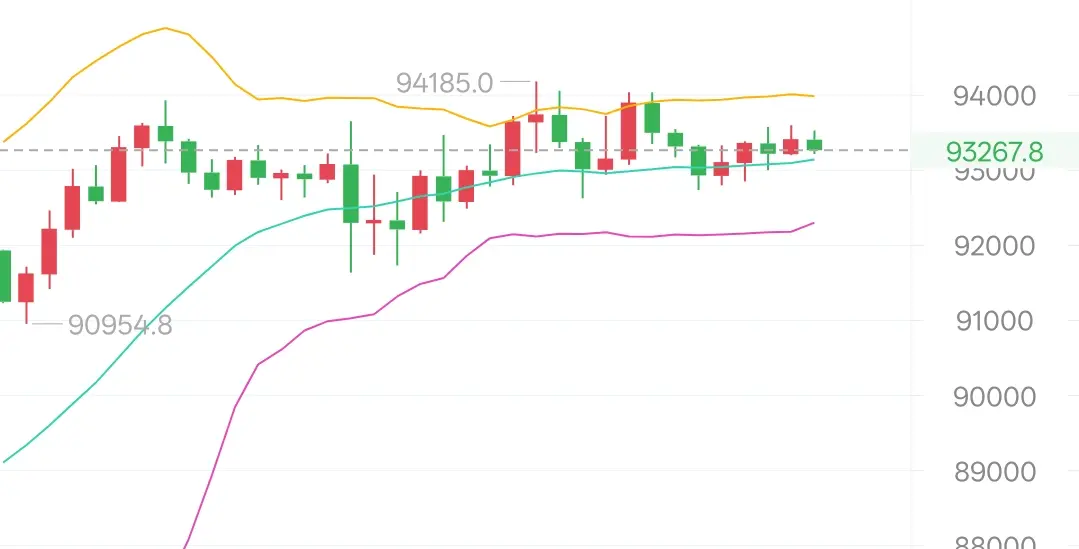
The current BTC candlestick pattern is a relatively strong consolidation structure. On the 1-hour chart, it shows a range-bound pattern following a surge and pullback. Previously, the price quickly rose from 91637 to the intraday high of 94185, then pulled back and fluctuated repeatedly within the 93000-93500 range. Recently, the candlesticks have alternated between small bullish and bearish candles, with no major bearish breakdowns, indicating a consolidation after an upward move.
At present, BTC is above the middle band of the Bollinger Bands at 93147, with the middle band sl
BTC1.33%
MC:$3.42KHolders:2
0.00%
- Reward
- 1
- Comment
- Repost
- Share