WallStreetTrendResearch
vip
Age 7.3 Yıl
Peak Tier 0
No content yet
I originally planned to buy in at $0.22, but ended up adding a bit more at $0.222. Every time the price drops a bit, I add to my position. I'm used to averaging down to lower my cost.
PI-1.53%
View Original
  • Reward
  • 8
  • Repost
  • Share
GateUser-91afa84avip:
Nonsense
View More
$PI Here are some of my thoughts on this coin; if you don't like them, please don't criticize.
PI-1.53%
View Original
post-image
  • Reward
  • 16
  • Repost
  • Share
SincereGratitudevip:
Dr. Fan, the project needs 3-5 years of development before it can fully take off.
View More
$PI needs to hold above $0.23 for 3 days for the market to have a chance to move upwards, because right now the 5-day moving average on the daily chart is exactly at $0.23. The 5-day moving average is the main line that drives other daily moving averages upward. At the same time, $0.23 was also a previous consolidation platform. If $0.23 is not broken, it acts as resistance; once $0.23 is broken, it becomes support. Therefore, holding above $0.23 for 3 days is necessary to confirm it as support, because sometimes there are false breakouts that lure buyers in, so requiring 3 days of stability
PI-1.53%
View Original
  • Reward
  • 4
  • Repost
  • Share
GoWithTheFlowvip:
坚定HODL💎
View More
This kind of small bullish rise like $PI is useless, it's about to go down soon.
PI-1.53%
View Original
  • Reward
  • 3
  • Repost
  • Share
WallStreetTrendResearchvip:
0.23 has already broken through.
View More
There is no need to panic as long as there is no large bearish candle on the daily chart. If the daily chart continuously shows small bearish and bullish candles or consecutive doji stars, then a trend reversal is likely to occur. The reversal could be either downward or upward.
PI-1.53%
View Original
  • Reward
  • 1
  • Repost
  • Share
ANineVegetableRootvip:
You can post more updates, learn, consult, and always be ready to buy the dip or sell at any time.
$PI The market has shifted from weak to strong, so it won't reach $0.231. With a bullish candlestick appearing and additional funds buying in, the market will change.
PI-1.53%
View Original
  • Reward
  • 6
  • Repost
  • Share
SwordEnlightenmentvip:
In this round, I should have bought into the ETF narrative. I'm still not confident about PI, and most retail investors in the crypto space look down on PI.
View More
$PI Today's goal is to reach $0.236 and fix the 4-hour chart. The 4-hour trendline has already been fixed. The daily indicator has bottomed out, but it will need some time.
PI-1.53%
View Original
  • Reward
  • 1
  • Repost
  • Share
WallStreetTrendResearchvip:
The current trend will continue downward and will reach the $0.231 level.
$PI got guessed right again. After all the hard work, the small upward trend was weak, and a single bearish candlestick sent it straight down.
PI-1.53%
View Original
post-image
  • Reward
  • Comment
  • Repost
  • Share
$PI lacks upward momentum, just slowly crawling up like this until eventually a big bearish candle sends it straight down.
PI-1.53%
View Original
  • Reward
  • 1
  • Repost
  • Share
ANineVegetableRootvip:
A big red candlestick dropped straight to 0.1, haha
$PI Many people say that I use stock market thinking to understand cryptocurrencies. My answer to that is: don't cryptocurrencies also need a large amount of capital buying in to push the price higher? I believe that both stocks and cryptocurrencies are all about the relationship between volume, price, time, and space.
PI-1.53%
View Original
  • Reward
  • 2
  • Repost
  • Share
WallStreetTrendResearchvip:
Why is Bitcoin Cash rising so well? You can take a look at its weekly and monthly chart patterns. This is what I've always mentioned: the small trend follows the big trend.
View More
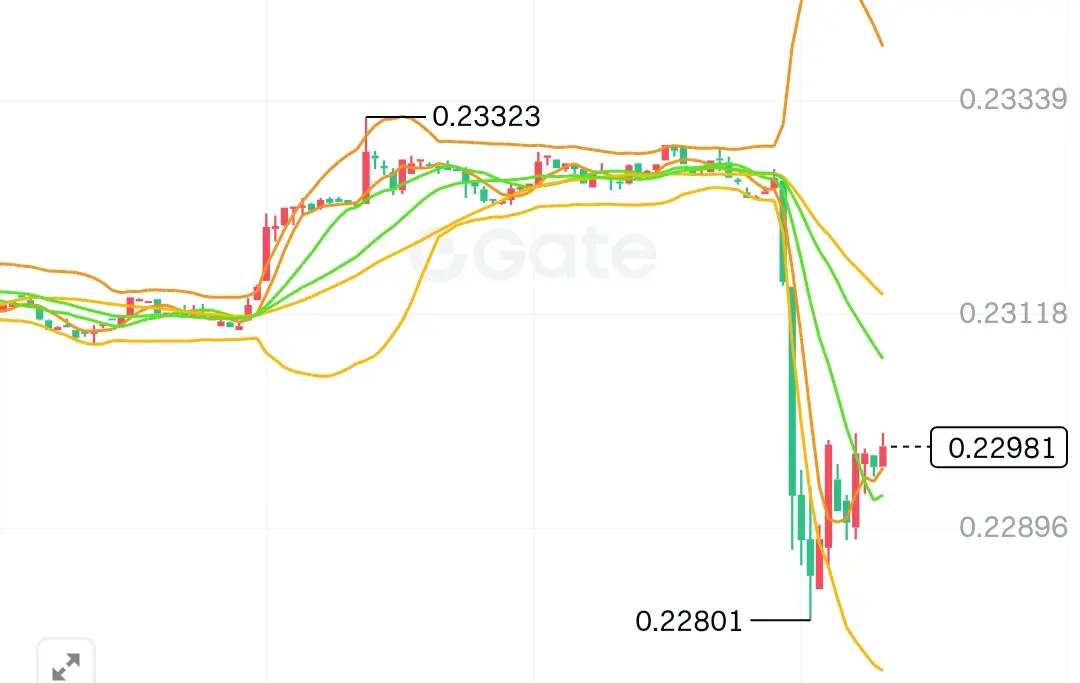
$PI Don't say it will fall below 0.1 USD, it’s difficult to even fall below 0.2 USD. The deepest drop recently was on October 10, 2025, closing at a minimum of 0.1555 USD and 0.19 USD. The long lower shadow indicates that large funds have been waiting at that level. Looking at the weekly chart, the 5-week line and the turning 10-week line are flattening out, around 0.23 USD, so I believe there should be support at 0.23 USD. Additionally, the MACD on the weekly chart is moving towards the 0 axis, while the daily chart, despite the decline, has not broken below the 0 axis in MACD. Consideri
PI-1.53%
View Original
  • Reward
  • 8
  • Repost
  • Share
区块链天才老四vip:
The analysis is very rational.
View More
$PI Today, it must hold above 0.2365 at least for there to be a possibility of a pump. This position is approximately where the daily chart 5-day line is located. The 5-day line is known as the attack line, the 10-day line is the operation line, and the 20-day line is the lifeline.
PI-1.53%
View Original
  • Reward
  • 4
  • Repost
  • Share
GateUser-eeced99avip:
Whether it goes up or down has nothing to do with it; don't analyze the trends of virtual coins with stock market thinking. There is no top for virtual coins, and the bottom is zero.
View More
$PI There really isn't much market activity right now, as I mentioned last month that there will be a long period without market movements. By the end of this month, around December 27th, there will be a third attempt to hit the upper edge of the trading range. Whether it succeeds or not depends on the volume; volume is real money. For prices to rise, it relies on money being piled up.
PI-1.53%
View Original
  • Reward
  • 5
  • Repost
  • Share
WallStreetTrendResearchvip:
So for short-term trading, you should at least look at the 4-hour chart. You can open the 4-hour chart to see if the price is above the moving average when there are consecutive Bullish lines rising on the left. However, the price should not be too far from the moving average; if it's too far, there will be an inertia pullback action. If the price is below the moving average, there are basically no good market conditions, and there are more Bearish lines, which have a suppressive effect.
View More
The market $PI is indeed very frustrating, bouncing up and down, and it's hard to know what it will do. If you calm down, you will understand what it is trying to do; perhaps we can find some answers from the path we've walked so far. Now, the market has been fluctuating within a large trading range since September, so generally, there isn't much big movement during fluctuations. It's oscillating within the range of 0.192—0.3 USD, and only breaking through the upper edge of 0.3 USD will lead to a significant movement. So when will it break the upper edge? Typically, the probab
PI-1.53%
View Original
  • Reward
  • 8
  • Repost
  • Share
WallStreetTrendResearchvip:
The market makers cannot control the market with this amount of chips now, and I don't know about the coins. I only know that market makers need to hold at least 30% of the circulating chips to control the market for a stock.
View More
$PI The market is as expected. It was mentioned in mid-last month that there would be no major movements for at least a month. Even if the daily chart rises, it will still fall back because the daily chart is still a small trend compared to the weekly, monthly, and yearly charts as well as the quarterly chart. There is a principle that small trends follow big trends. If the daily chart needs to adjust, then the hourly chart must go down; otherwise, the depth of the adjustment will not be sufficient, and without sufficient depth, the momentum for a pump will not be strong. The development of a
PI-1.53%
View Original
  • Reward
  • 7
  • Repost
  • Share
WallStreetTrendResearchvip:
I have never claimed to be that much of a bull; you can check all my comments. I just follow the stocks or coins that have risen well over the past 10 years, and they all share a common characteristic.
View More
$PI Set sail and raise the flag.
PI-1.53%
View Original
  • Reward
  • 1
  • Repost
  • Share
WallStreetTrendResearchvip:
What a long wick candle probing the bottom.
$PI 15 minutes are about to see an inverse head and shoulders pattern.
PI-1.53%
View Original
  • Reward
  • 3
  • Repost
  • Share
GateUser-c910dc99vip:
Sure, pro, I think you have a good perspective.
View More
$PI Falling is good, the daily chart indicators still need to go down, but if the price doesn't fall, it will form a bottom divergence, which is a phenomenon of hitting the bottom.
PI-1.53%
View Original
  • Reward
  • 4
  • Repost
  • Share
WallStreetTrendResearchvip:
Already bottomed out, the fall is limited.
View More
$PI keeps promises
PI-1.53%
View Original
post-image
  • Reward
  • 8
  • Repost
  • Share
WallStreetTrendResearchvip:
The 12-hour adjustment won't take long, the 8-hour has already turned, the weekly chart is still upward, and there are no issues with the daily chart.
View More
$PI adjustments are ongoing, and it definitely has to go down; otherwise, the adjustment won't happen in 8 to 12 hours. The daily chart indicators also need to go down, and currently, there are no signs of a turnaround. However, the short positions' strength has decreased significantly. My view from a few days ago still stands that it will reach the position of 0.235 USD.
PI-1.53%
View Original
  • Reward
  • 1
  • Repost
  • Share
ANineVegetableRootvip:
It will probably be adjusted downwards next.
  • Trending TopicsView More
  • Pin
Trade Crypto Anywhere Anytime
qrCode
Scan to download Gate App
Community
  • 简体中文
  • English
  • Tiếng Việt
  • 繁體中文
  • Español
  • Русский
  • Français (Afrique)
  • Português (Portugal)
  • Bahasa Indonesia
  • 日本語
  • بالعربية
  • Українська
  • Português (Brasil)