Highlights
①.Gate's "Basic Futures Contracts" course introduces various methods of technical analysis that are commonly employed in futures trading. The aim of these courses is to help traders establish a comprehensive framework for technical analysis. Covered topics include the basics of Candlestick charts, technical patterns, moving averages, trend lines, and the application of technical indicators.
②.Class III of the series "Master Technical Analysis", will guide users through various bullish candlestick combinations that are commonly used in trading, and will cover patterns of the combinations as well as their technical meanings.
1. Downward Accelerator
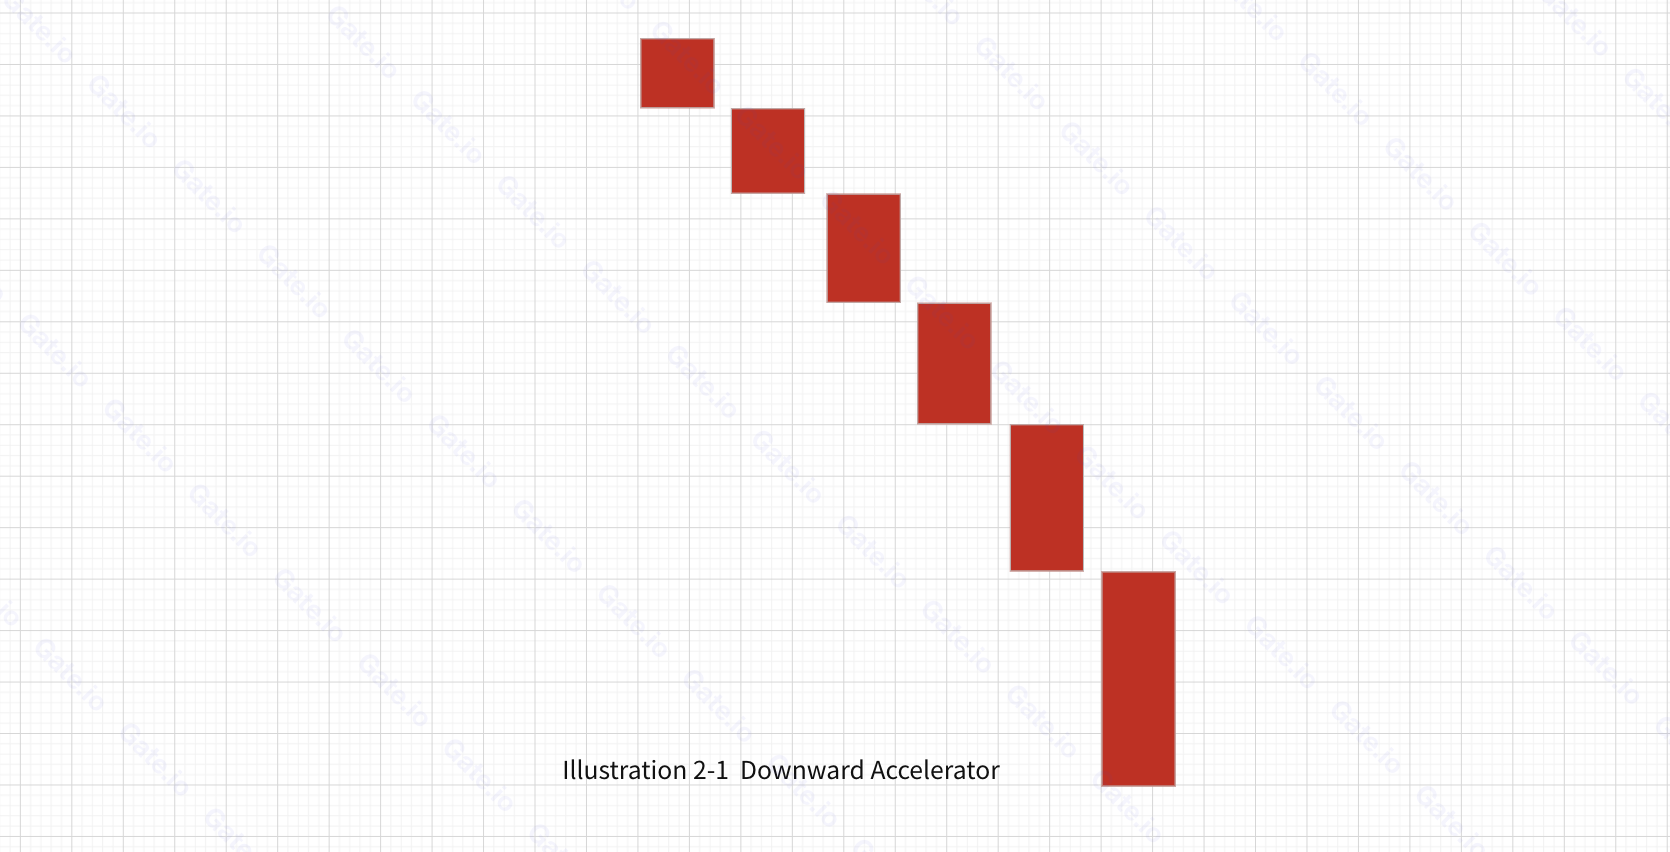
①. Pattern
The pattern emerges during a process in which the price declines at an increasingly rapid pace. Figure 2-1 provides an example of this pattern.
- It is observed during a downward trend in price.
- Initially, the decline progresses at a gentle pace, but it then accelerates. In the later stages, consecutive days often end with medium or long red candles.
②. Technical meaning
This pattern suggests that the price is nearing its bottom and is highly likely to rebound.
2. Morning Star
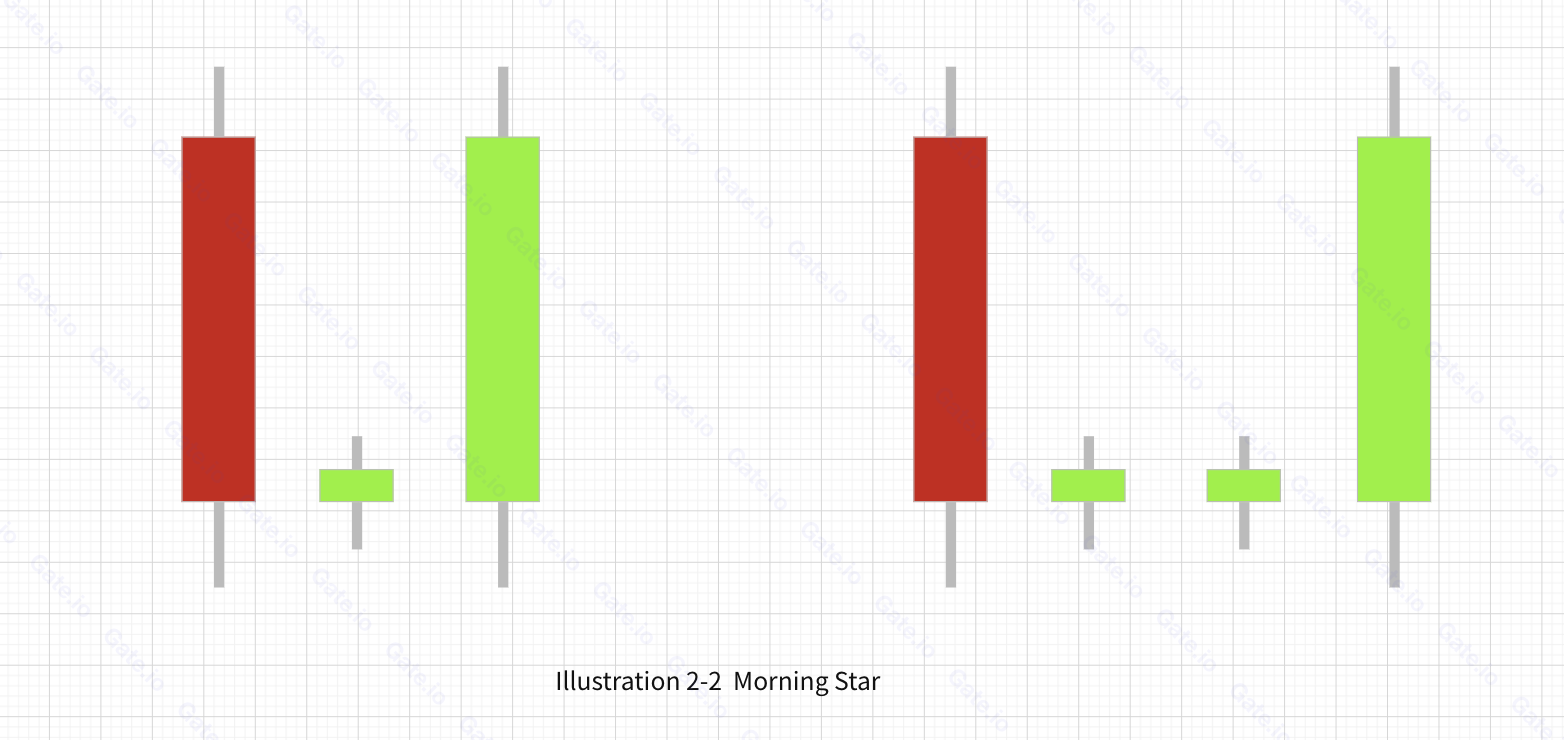
①. Pattern
(1) It appears in a downward trend;
(2) It consists of three candlesticks: the first is a red candle , then comes a short red candle that opens low, a short green candle, or a cross candle, and then comes the green candle;
(3) The third candle goes deep into the first candle.
②. Technical meaning
The pattern indicates that the downward momentum is waning and that a bull market is emerging.
3. The Rising Sun
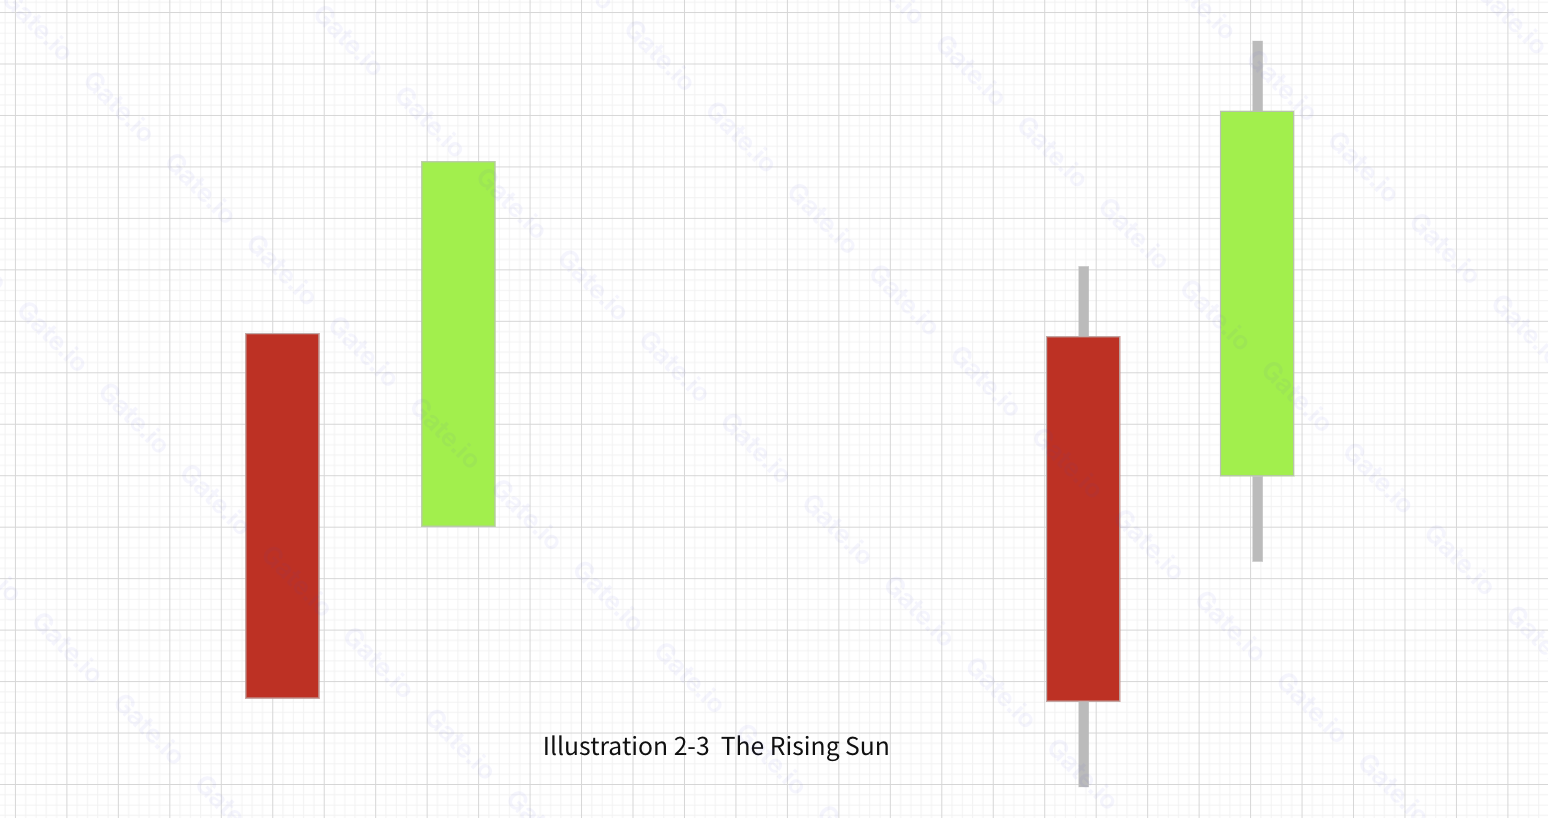
①. Pattern
(1) It appears in a downward trend;
(2) It consists of a long red candle, and then a long green candle that opens high and closes high;
(3) The closing price of the green candle is higher than the opening price of the red candle.
②. Technical meaning
The pattern signifies that the bearish trend is diminishing and there is a high potential for a bullish market.
4. Round Bottom
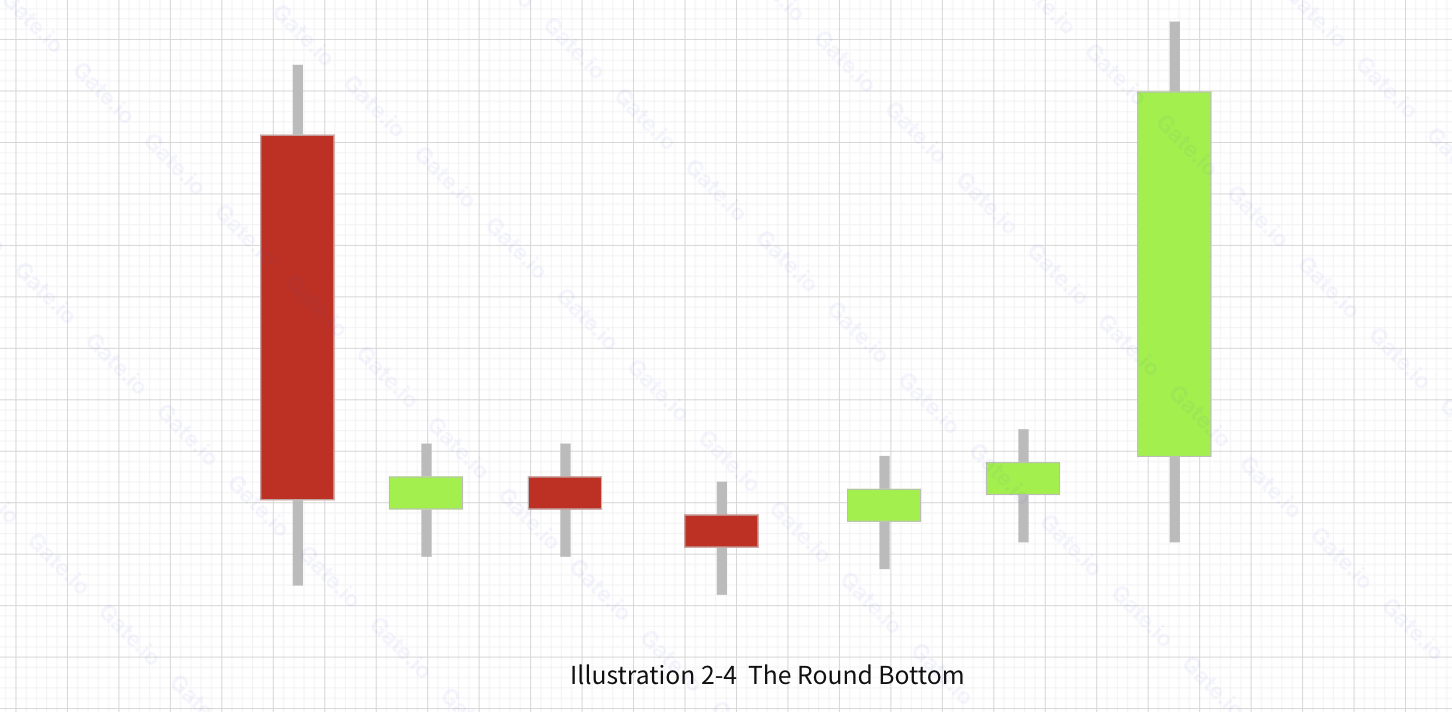
①. Pattern
(1) It appears during a downward trend or consolidation process;
(2) It consists of a long red candle, then followed by an array of short red and green candles that arrange in form an arc at its bottom.
②. Technical meaning
It is one of the most reliable bullish candlestick patterns, signifying a high likelihood that the market will recover from the current downward trend.
5. Three White Soldiers
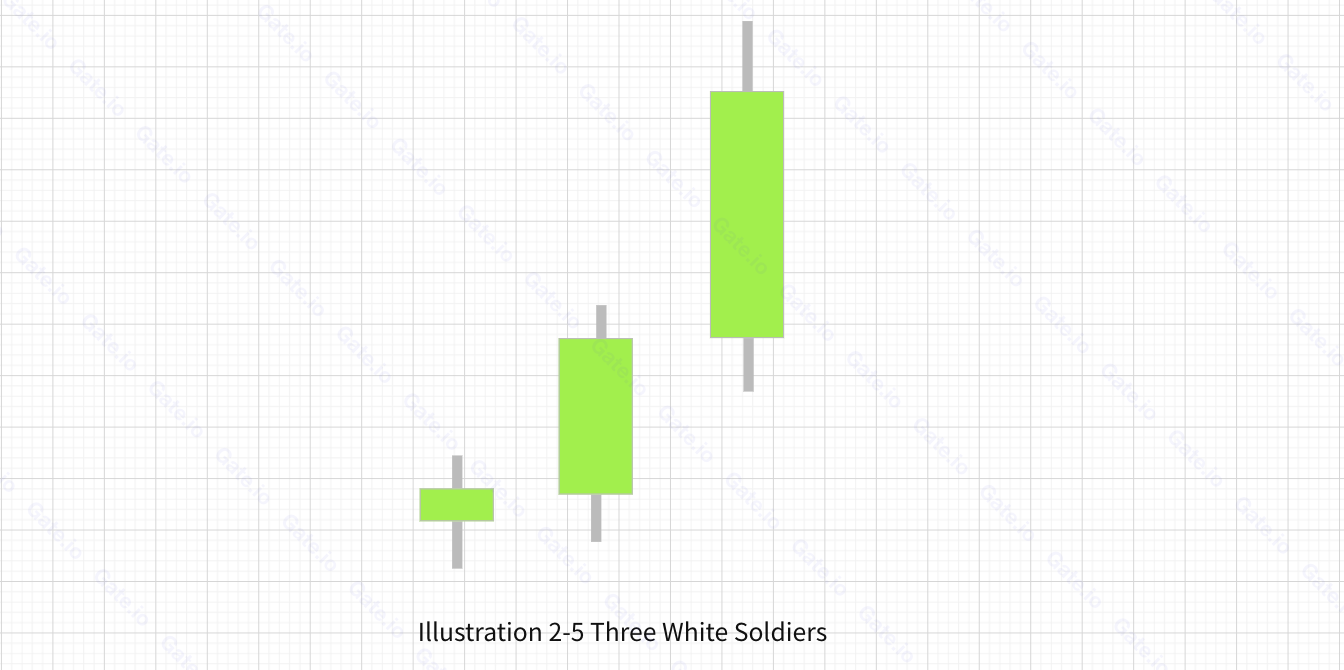
①. Pattern
(1) It appears in the early stage of a rising trend or after a sideways movement;
(2) It is composed of three small green candles, each with a higher open and close price than the previous one.
②. Technical meaning
This pattern signifies the potential for a bullish trend. It is time to open long positions.
6. Steady Rise
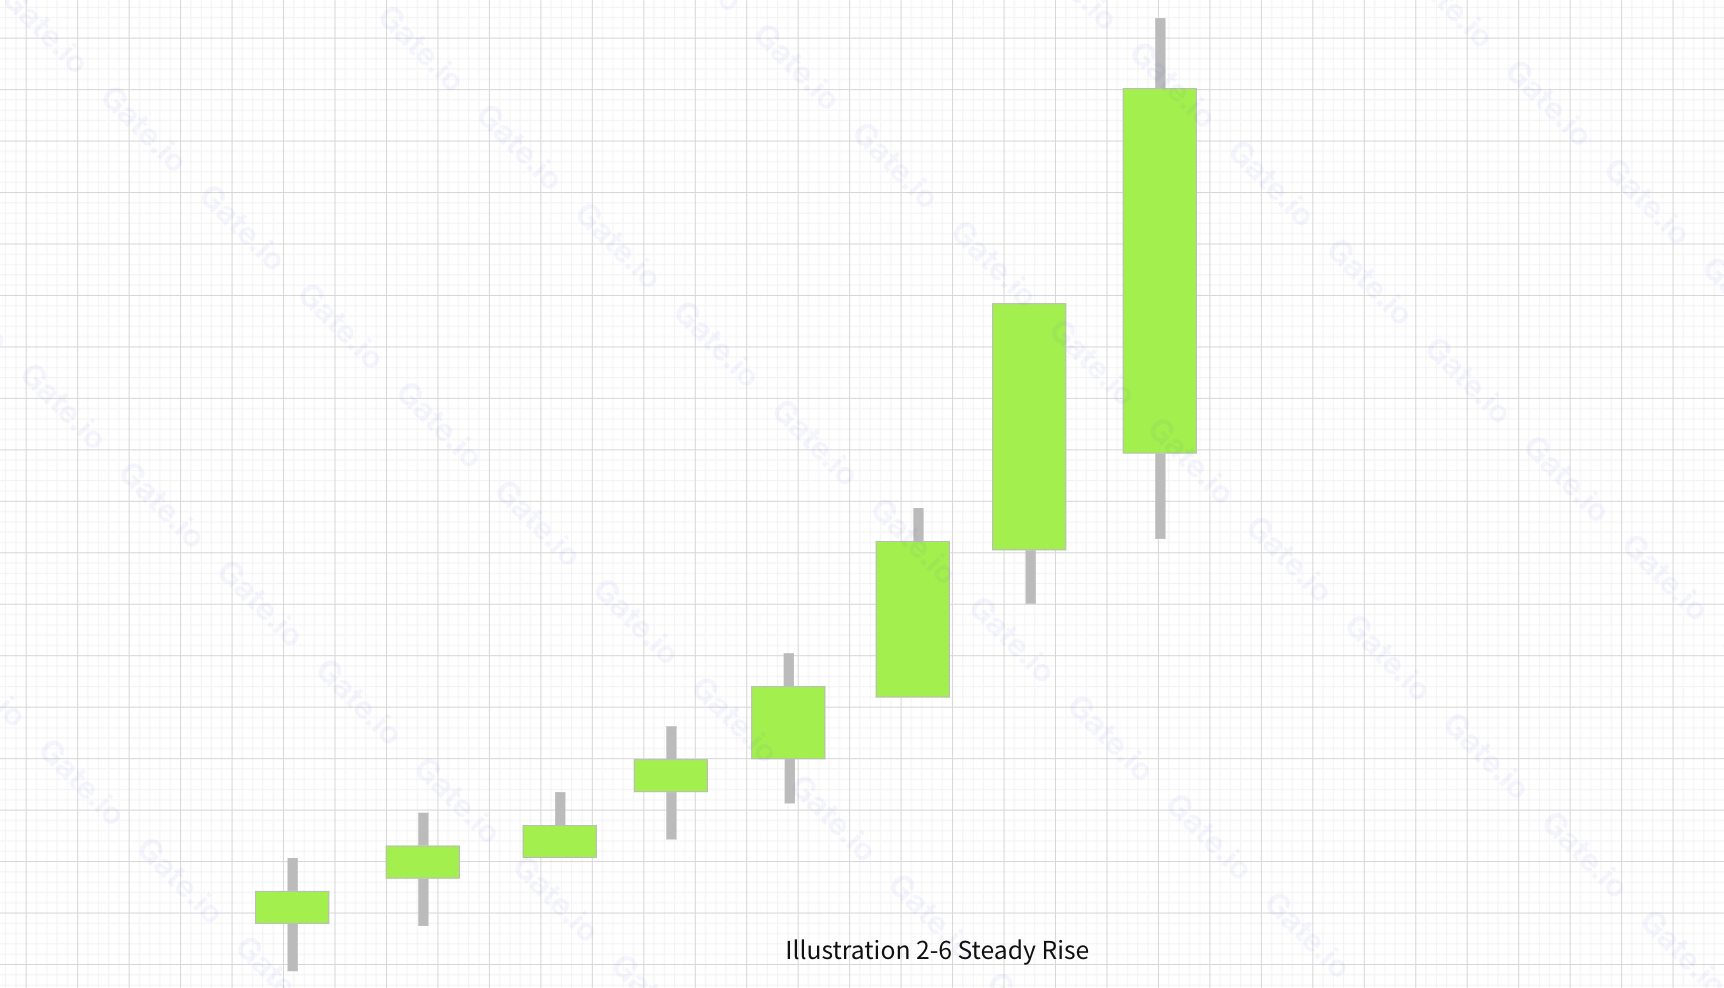
①. Pattern
(1) It appears in a rising market;
(2) It consists of many green candles, mingled with a few short red candles ;
(3) The candles are arranged along an upward slope.
②. Technical meaning
This pattern signifies the potential for a bullish trend. It is time to open long positions.
7. Two Stars
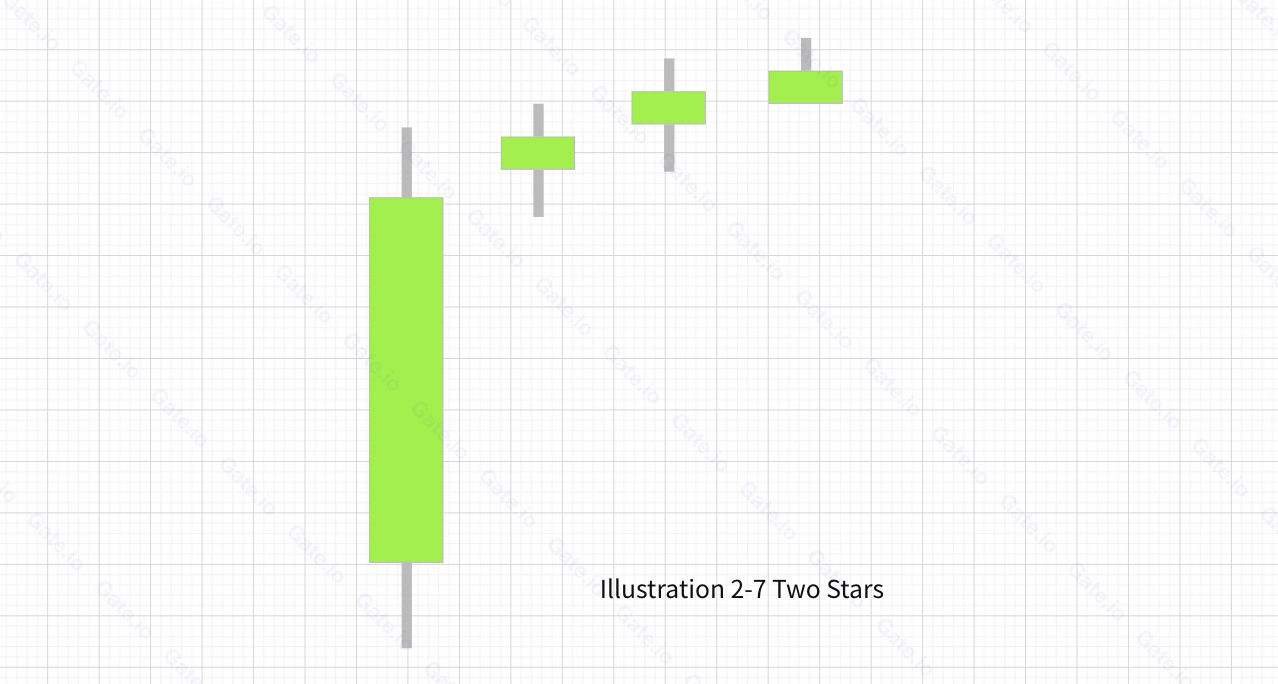
①. Pattern
(1) It appears in an upward trend;
(2) It consists of three candlesticks: the first one is a long green one, and above it comes two short candles , which could be a cross candle, a cross star, or a small green candle or a small red candle.
②. Technical meaning
This pattern signifies the potential for a bullish trend. It is time to open long positions.
8. Running High
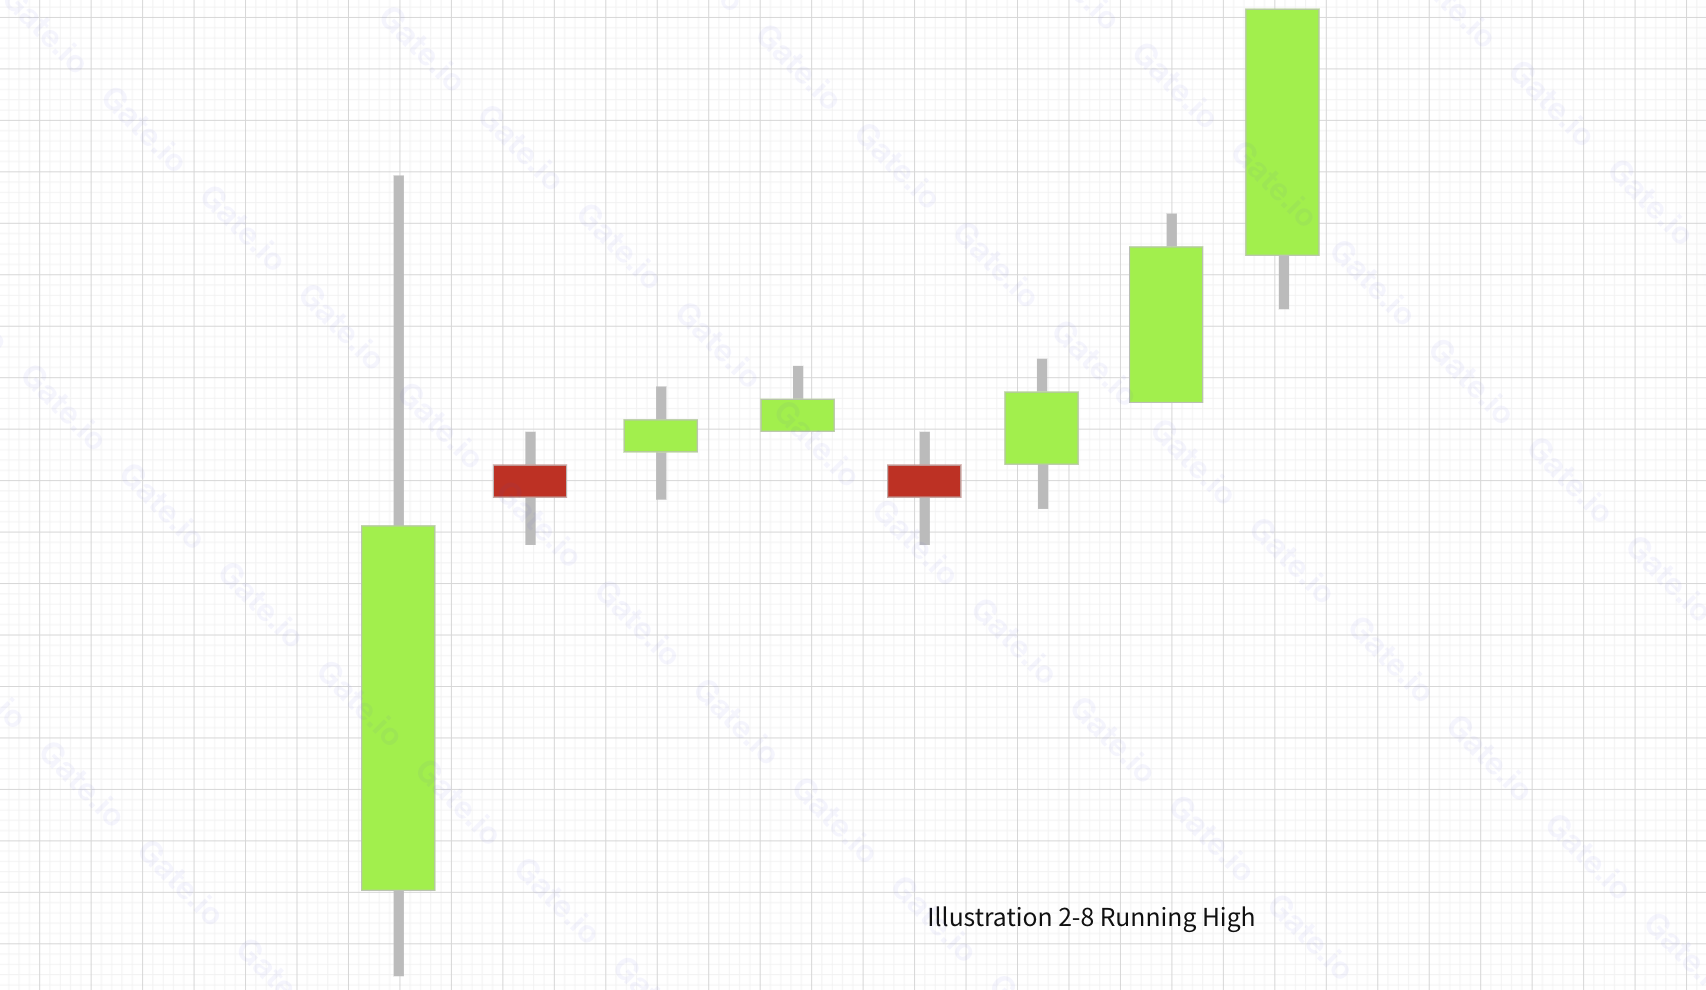
①. Pattern
(1) It appears in a rising market;
(2) It is composed of several candles;
(3) The pattern goes with a long green candle, connecting with a long shadow above;
(4) The price falls a little and then quickly turns upward to go above the upper edge of the first long green candle.
②. Technical meaning
This pattern signifies the potential for a bullish trend. It is time to open long positions.
9. Two Green Candles and a Red Candle
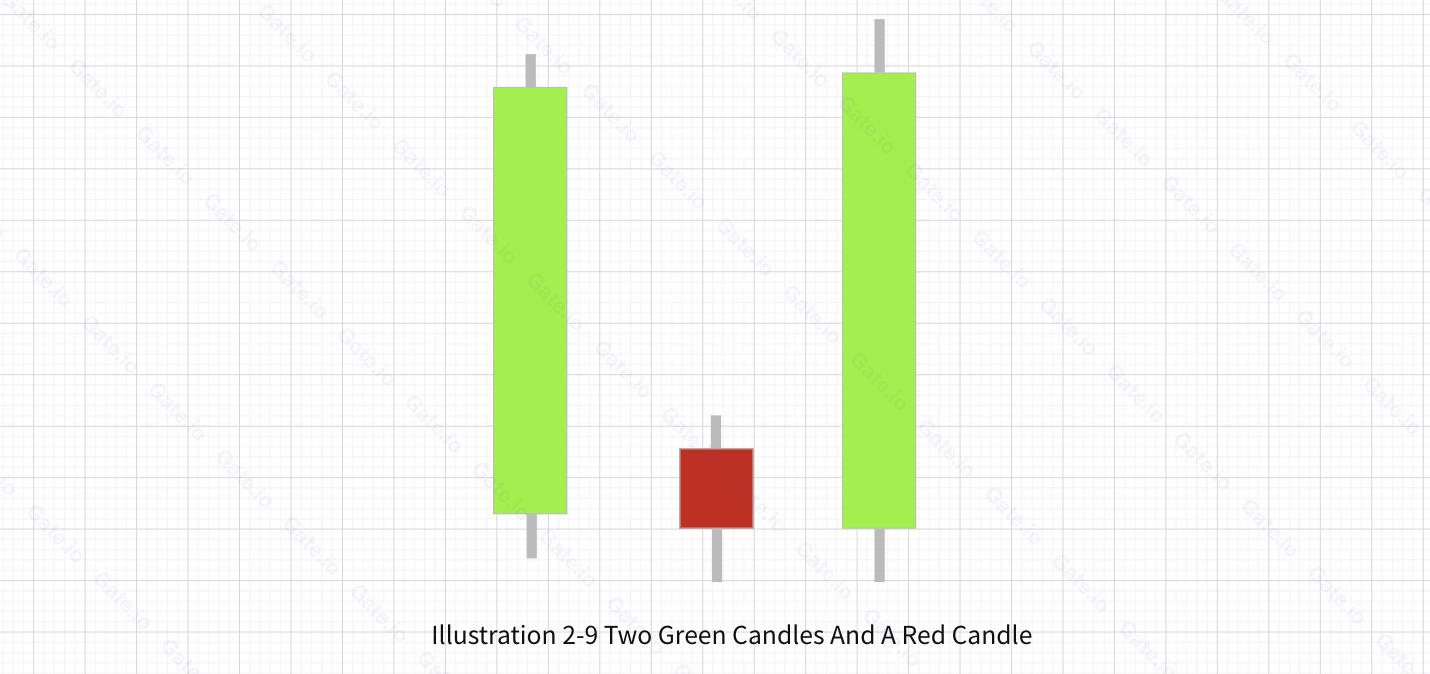
①. Pattern
(1) It can appear in either an upward trend or a downward trend;
(2) It consists of two long green candles with a short red candle in between ;
(3) The central axes of the three candles are basically at a horizontal height.
②. Technical meaning
(1) If the pattern appears in an upward trend, it signifies the bullish trend may continue. Traders should maintain the holding of the current positions;
(2) If the pattern appears in a downward trend, it suggests the bearish trend is fading and a bull market can be expected.
10. Summary
This article introduces various bullish candlestick combinations commonly used in futures traders, by elaborating upon the pattern as well as the technical meanings of each combination. As useful as those indicators are, traders should never solely depend upon any of such indicators to make any trading decisions. Once you read a signal from the candlestick pattern, it is advisable to double-check with other strategies and indicators to improve your success rate in trading.
Start trading futures by registering on Gate Futures.

Disclaimer
This article is for informational purposes only and does not constitute investment advice. Gate is not responsible for any investment decisions you make. Content related to technical analysis, market assessments, trading skills, and traders' insights should not be considered a basis for investment. Investing carries potential risks and uncertainties. This article offers no guarantees or assurances of returns on any type of investment.
Disclaimer
The content provided herein is for reference and educational purposes only and does not constitute any financial, investment, trading, or legal advice, nor does it constitute an offer or solicitation to buy or sell any digital assets. Gate makes no express or implied representations or warranties regarding the accuracy, completeness, or timeliness of the information contained herein. Product features, interfaces, rules, and fee structures may be updated or adjusted at any time. Please refer to the latest announcements and the actual information displayed on the Gate platform for the most accurate details.
Digital asset investments involve significant risk, and prices may fluctuate substantially. You may lose the entire amount of your investment. Please make decisions cautiously based on your own financial situation and risk tolerance after fully understanding the associated risks. If necessary, you are advised to consult an independent professional financial or legal advisor.
For more information about potential risks, please refer to Gate's Risk Disclosure and User Agreement.
